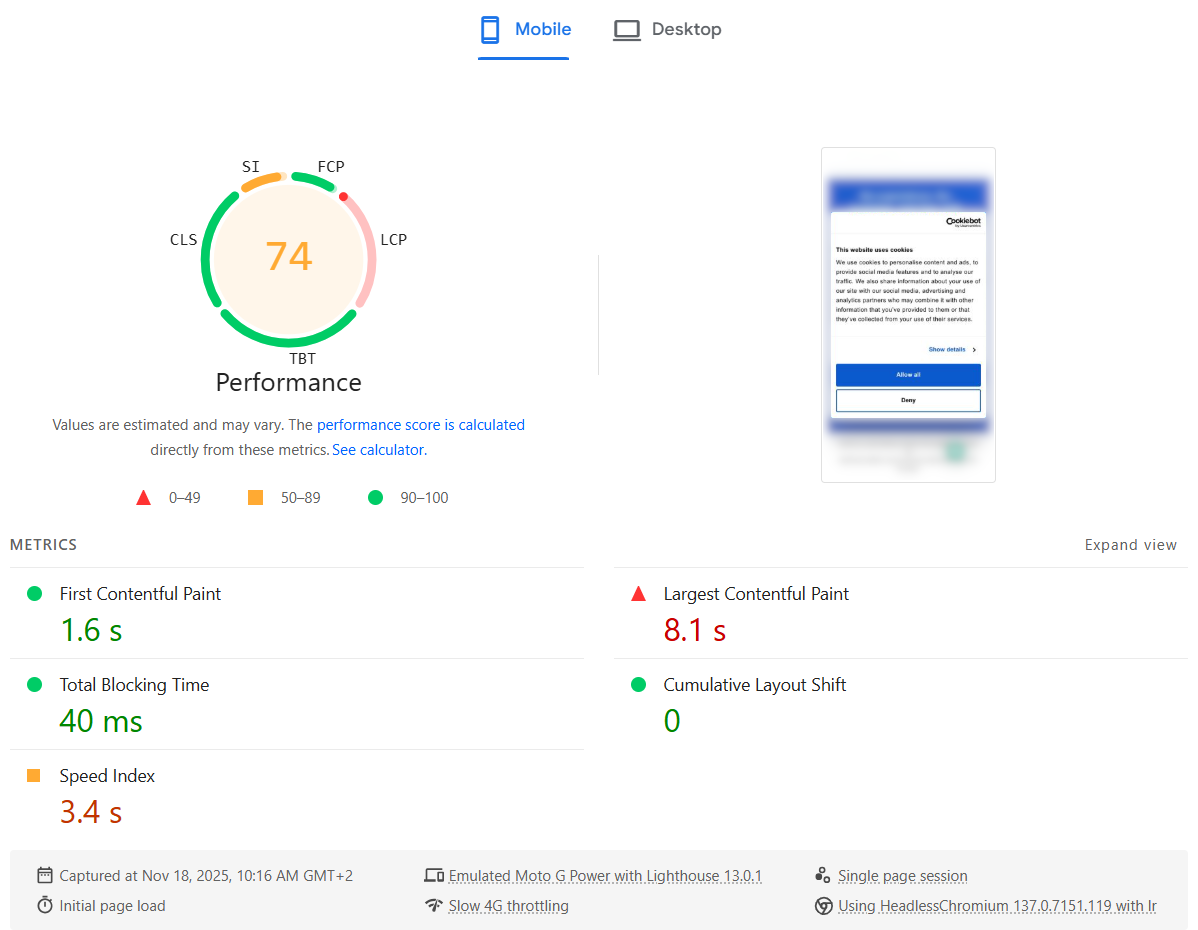
Recently we added Cookiebot to our corporate website for better GDPR and privacy compliance. Immediately after that, the PageSpeed InsightsPerformance score for Mobile dropped from Good (green) to Needs Improvement (orange). The Desktop score was not affected at all.
Digging into the details, the Largest Contentful Paint (LCP) metric was suddenly marked as Poor (red).
The strange part: in reality, the website still felt just as fast as before — including the Cookiebot banner. Everything appeared quickly, and users wouldn’t notice any slowdown. It felt like Lighthouse was “wrong”: it was measuring something that didn’t match the actual user experience.
Here is what the PageSpeed Insights test showed:
Why it only happens on mobile
My theory:
The mobile viewport is smaller, so the Cookiebot consent dialog text block occupies a big portion of the screen.
That makes the Cookiebot banner the largest element in the viewport, so it becomes the LCP candidate.
In the Lighthouse mobile test, CPU is heavily throttled, so Cookiebot’s JavaScript (plus other third-party scripts) takes much longer to parse, execute and finish.
As a result, LCP is reported as very slow — even though visually the page looks complete very quickly.
In other words, the metric blames LCP on the Cookiebot dialog, but this doesn’t reflect what real users see.
The fix: make the Cookiebot dialog smaller
To fix this, we need to make sure the Cookiebot dialog is no longer the largest element in the viewport. That means shrinking its visual footprint, especially on mobile.
The main changes are:
Remove the Cookiebot logo banner
Use smaller fonts and buttons
Reduce the overall dialog width/height, particularly on small screens
You can apply all of this with a bit of custom CSS. Here is the CSS I used:
After adding it, test the site with different devices and viewport sizes, including Desktop, Tablet and Mobile, to ensure the dialog still looks good and remains accessible.
Results
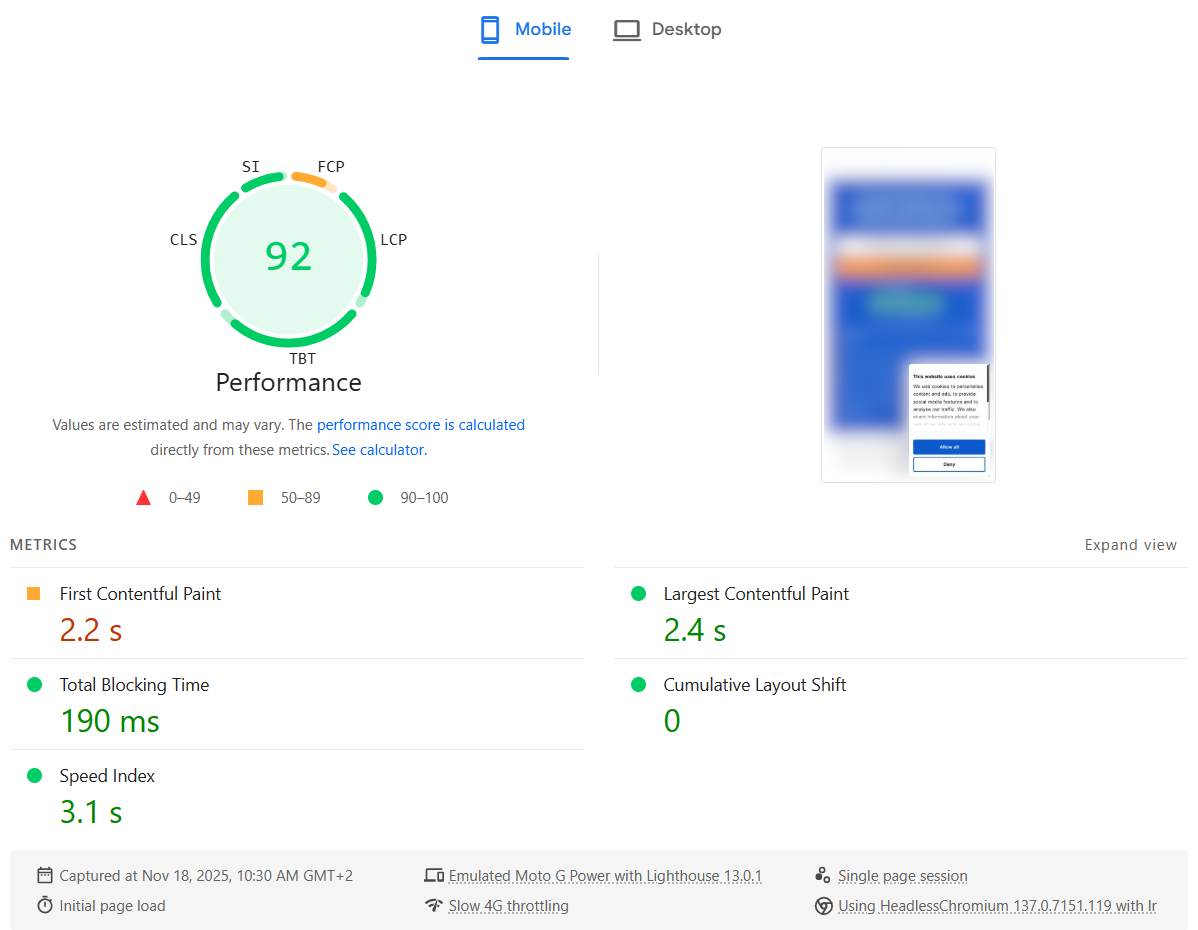
After applying the CSS, the PageSpeed Insights report improved immediately: the LCP metric went back to a healthy value and the overall Mobile Performance score returned to green.
Here is what the PageSpeed Insights test showed after the fix:
So if Cookiebot is tanking your LCP score on mobile, try shrinking the consent dialog — you may be able to fix your Core Web Vital without changing anything else in your frontend.
PHP-FPM (FastCGI Process Manager) is a powerful solution for managing PHP processes, but it poses challenges when updating PHP applications or configurations without impacting active requests. A key setting in PHP-FPM is process_control_timeout, which dictates how long the master process waits for a child to finish before forcefully terminating it on graceful restart. If a slow child lingers, incoming requests queue up, causing delays for the duration of the timeout. This delay can lead to significant downtime, especially for high-traffic applications.
The Solution: Zero-Downtime Restarts and Atomic Deployments
These challenges are addressed through a proof-of-concept designed to enable zero-downtime PHP-FPM restarts and atomic source code updates, ensuring seamless service continuity. Key components of the solution include:
Redundant PHP-FPM Pools with Replicas:
PHP-FPM instances are managed in redundant pools with at least two replicas.
While one replica restarts, the other remains active, ensuring no downtime.
Load Balancer Management:
A lightweight load balancer dynamically toggles traffic between replicas during restarts, making the switch invisible to users.
Atomic Code Deployment:
Instead of directly using the “release” symlink as the PHP-FPM working directory, the release target is mounted in an isolated user namespace before starting the PHP-FPM master processes.
This ensures that changes to the symlink location can be made immediately for new deployments, while running PHP-FPM masters continue to use their isolated view of the release directory until they are restarted at a convenient time.
Important Considerations
Static Content and Atomicity:
In this setup, Apache serves static content (files not ending in “.php") directly by following the “release” symlink. This means that updates to the “release” symlink immediately impact Apache-served static files, diverging from the atomic deployment of PHP sources.
To achieve true atomic deployment of both static content and PHP files, the setup must be reworked. This could involve putting both PHP and static file serving behind a single backend and managing traffic between two such backends in the same way that traffic is currently managed between PHP-FPM backends.
Temporary Capacity Reduction:
During the restart of one replica (PHP-FPM master), only half of the capacity is available. This capacity reduction should be considered in the context of the expected traffic load during deployments or restarts.
Increased Memory Usage:
Running two (or more) identical PHP-FPM masters introduces higher memory consumption, as each master maintains its own independent OPcache. This redundancy ensures reliability and atomicity but comes at the cost of increased resource usage.
Demo, documentation and source code
The full code and setup guide are available on GitHub. Contributions and feedback are welcome!
Quality of Service (QoS) in MQTT is well explained by the HiveMQ Team. With the exception of one subtle detail: QoS messages are never “upgraded”, so if the original publisher sent a message with QoS 0, a QoS 2 subscriber will still receive the message as QoS 0. That’s what Dominik from the HiveMQ Team explained in a comment and it was also reiterated by his colleague Dasha in another comment.
Another discussion about this explains the same thing but points to an interesting feature of the Mosquitto MQTT broker:
upgrade_outgoing_qos [ true | false ]

The MQTT specification requires that the QoS of a message delivered to a subscriber is never upgraded to match the QoS of the subscription.

Enabling this option changes this behavior. If "upgrade_outgoing_qos" is set "true", messages sent to a subscriber will always match the QoS of its subscription. This is a non-standard option not provided for by the spec.

Defaults to "false".
Normally, the Node.js process will exit when there is no work scheduled (docs). You shouldn’t call process.exit() unless it is necessary to terminate the Node.js process immediately due to an error condition. Calling process.exit() doesn’t let pending events to complete which may lead to unpredictable results as demonstrated in the docs.
Now that we know how to naturally terminate a Node.js application, how do we achieve it if we are using the Firebase JavaScript SDK?
First you need to cancel any asynchronous listeners. For example, if you subscribed for data changes, you need to unsubscribe:
let func = firebase.database().ref(userDB).on("value", myHandler);
...
firebase.database().ref(userDB).off("value", func);
Some people suggest that you also call firebase.database().goOffline() in the final stage.
Additionally, as described in these bug reports (#1 and #2), if you used firebase.auth() you need to call firebase.auth().signOut().
And finally, you also need to destroy the Firebase application by calling app.delete().
This has worked for me using Node.js version 10 and Firebase JS SDK version 8.
PHP-FPM keeps a shared Opcache memory between the parent process and all its child processes in a pool. The idea is to compile source code once and then reuse it in all child processes directly as byte code. This is efficient but as a System administrator I recently stumbled across a problem – how to find out the real memory usage by the Opcache in the operating system?
I thought a simple “ps” list would reveal the memory usage because it would be accounted to the parent process, because the parent process created the anonymously shared mmap() region. Linux doesn’t work this way. In order to debug this easily, I created a simple program which does the following:
The parent process creates a shared anonymous memory region using mmap() with a size of 2000 MB. The parent process does not use the memory region in any way. It doesn’t change any data in it.
Two child processes are fork()’ed and then:
The first process writes 500 MB of data in the beginning of shared memory region passed by the parent process.
The second process writes 1000 MB of data in the beginning of the shared memory region passed by the parent process.
Here is how the process list looks like:
This file contains hidden or bidirectional Unicode text that may be interpreted or compiled differently than what appears below. To review, open the file in an editor that reveals hidden Unicode characters.
Learn more about bidirectional Unicode characters
A quick explanation of this process list snapshot:
VSZ (virtual size) of the parent and child processes is 2000 MB because the parent process has allocated 2000 MB of anonymous memory using mmap(). No additional allocations were made by the child processes as they were passed a reference to the anonymously shared memory in the parent process. Therefore the virtual memory footprint of all processes is the same.
RSS (resident set size, or simply “the real usage”) is:
Almost none for the parent process because it never used any memory. It only “requested” the memory block by mmap().
500 MB for the first child processes because it wrote 500 MB of data at the beginning of the shared memory region.
1000 MB for the second child processes because it wrote 1000 MB of data at the beginning of the shared memory region.
The “free -m” command shows that 1012 MB of anonymously shared memory is being used.
So far things seem kind of logical. We can roughly determine the real usage of the shared memory region by looking at the child processes. This however is also not really true because if they write at completely different regions in the anonymous memory, we would need to sum their usage. If they write to the very same memory region, we need to look at the max() value.
The pmap command doesn’t provide any additional information and shows the same values that we see in the “ps” output:
This file contains hidden or bidirectional Unicode text that may be interpreted or compiled differently than what appears below. To review, open the file in an editor that reveals hidden Unicode characters.
Learn more about bidirectional Unicode characters
Things get even more messy when the child processes terminate (and get replaced by new ones which never touched the shared anonymous memory). Here is how the process list looks like:
This file contains hidden or bidirectional Unicode text that may be interpreted or compiled differently than what appears below. To review, open the file in an editor that reveals hidden Unicode characters.
Learn more about bidirectional Unicode characters
The RSS (resident set size, or simply “the real usage”) of the parent process continues to show no usage. But the anonymous memory region is actually used because the child processes wrote data in it. And the region is not automatically free()’d, because the parent process is still alive. The “free -m” command clearly shows that there are 1000 MB of data stored in anonymous shared memory.
How can we reliably find out the memory usage of the anonymous shared region and account it to a given process?
A file containing the currently mapped memory regions and their access permissions. See mmap(2) for some further information about memory mappings. … If the pathname field is blank, this is an anonymous mapping as obtained via mmap(2). There is no easy way to coordinate this back to a process’s source, short of running it through gdb(1), strace(1), or similar.
Wikipedia gives the following additional information:
When “/dev/zero” is memory-mapped, e.g., with mmap(), to the virtual address space, it is equivalent to using anonymous memory; i.e. memory not connected to any file.
Now we know how to find out the virtual address of the anonymously memory-mapped region. Here I demostrate two different ways of obtaining the address:
This file contains hidden or bidirectional Unicode text that may be interpreted or compiled differently than what appears below. To review, open the file in an editor that reveals hidden Unicode characters.
Learn more about bidirectional Unicode characters
An internal shared memory filesystem is used for […] shared anonymous mappings (mmap(2) with the MAP_SHARED and MAP_ANONYMOUS flags). … The amount of memory consumed by all tmpfs filesystems is shown in the Shmem field of /proc/meminfo and in the shared field displayed by free(1).
We verify that the memory-mapped region is a “tmpfs” file:
This file contains hidden or bidirectional Unicode text that may be interpreted or compiled differently than what appears below. To review, open the file in an editor that reveals hidden Unicode characters.
Learn more about bidirectional Unicode characters
💚 We can then finally get the real memory usage of this shared anonymous memory block in terms of VSS (virtual memory size) and RSS (resident set size, or simply “the real usage”):
This file contains hidden or bidirectional Unicode text that may be interpreted or compiled differently than what appears below. To review, open the file in an editor that reveals hidden Unicode characters.
Learn more about bidirectional Unicode characters
Since we have access to the memory region as a file, we can even read this memory mapped region:
This file contains hidden or bidirectional Unicode text that may be interpreted or compiled differently than what appears below. To review, open the file in an editor that reveals hidden Unicode characters.
Learn more about bidirectional Unicode characters
Confusion is what I got the first time I wanted to automate Google Cloud using Python. While the documentation of Google Cloud is not bad, it’s far from ideal. Let me try to clarify things if you’re struggling with this like I did.
In its very core, Google Cloud API is an HTTP REST service (or gRPC for selected APIs). And you have two ways of accessing the Google Cloud API using Python:
Google API Client Libraries for Python — those are wrappers around the HTTP REST API which abstract some of the low level stuff and try to be more Pythonic.
While the “Client Libraries” is Google’s recommended option, my own experience shows that you’d better use the second option which accesses the HTTP REST API directly. That is because:
The Google Cloud HTTP REST API is documented better. I guess the reason for that is because it’s used by all the languages, not only Python, and because Google developers use it internally, too.
The official documentation of the Google Cloud services always gives an example for the REST APIs along with the other options like the web console, gcloud/gsutil, and the “Client Libraries” (where they are applicable).
The Google Cloud web console interface gives the resulting HTTP REST API or command line code of what you populated in the forms online. You can see this at the very bottom of the page. Therefore, you can use the web interface to enter what you indent to do and then easily see what you need to send to the HTTP REST API, in order to achieve the same as you’d do if you clicked it online.
Not all Google Cloud APIs are wrapped in “Client Libraries” for a specific language like Python. For example, Compute Engine is not, so you would most probably need to use the HTTP REST API directly anyway. If that’s the case, why learn two libraries when you can learn only one and use only the HTTP REST API.
The installation of the Python library for Google Cloud direct HTTP REST API access is easy. There is documentation but the process is as straightforward as “pip install google-api-python-client”. You can then access any Google Cloud HTTP API and here is an oversimplified example:
import googleapiclient.discovery
compute = googleapiclient.discovery.build('compute', 'v1')
result = compute.regions().list(project='my_project_id', maxResults=2).execute()
Please note that even the simple Python library for Google Cloud direct HTTP REST API access has its minor peculiarities and is not a 1:1 mapping of the API. For example, when you call an update() API the HTTP REST API documentation names the selector field “resourceId” while the Python library’s update() method names this field “healthCheck”, for example for the healthChecks().update() method. Therefore, you always need to consult both documentations when you develop your scripts.
Here is what I keep in my bookmarks when working with the Google Cloud API using Python:
Python library for Google Cloud direct HTTP REST API access — I consult it for the named arguments of the methods if they differ from the official API (see the example in the previous paragraph). Additionally, if you use the list() methods, the results are usually paginated and you have to call list_next() which is well documented.
AWS cloud services operate from many different regions (18 as of today).
It wasn’t long before I stumbled across the first problem — not all of them are enabled by default. The documentation says “Regions introduced after March 20, 2019, such as Asia Pacific (Hong Kong) and Middle East (Bahrain), are disabled by default. You must enable these Regions before you can use them.”
Enabling the Hong Kong (ap-east-1) and Bahrain (me-south-1) regions was super easy by following the documentation. I could manage all resources from the AWS web console.
Today I tried some operations from the AWS Command line interface (CLI) and got the following errors:
An error occurred (IllegalLocationConstraintException) when calling the DeleteBucket operation: The ap-east-1 location constraint is incompatible for the region specific endpoint this request was sent to.
An error occurred (IllegalLocationConstraintException) when calling the DeleteBucket operation: The me-south-1 location constraint is incompatible for the region specific endpoint this request was sent to.
fatal error: An error occurred (IllegalLocationConstraintException) when calling the ListObjects operation: The ap-east-1 location constraint is incompatible for the region specific endpoint this request was sent to.
fatal error: An error occurred (IllegalLocationConstraintException) when calling the ListObjects operation: The me-south-1 location constraint is incompatible for the region specific endpoint this request was sent to.
fatal error: An error occurred (InvalidToken) when calling the ListObjectsV2 operation: The provided token is malformed or otherwise invalid.
It turns out that the CLI authenticates using the “global” endpoint of the AWS Security Token Service (AWS STS). And by default, the “global” STS endpoint will not work with the two new regions: Hong Kong (ap-east-1) and Bahrain (me-south-1). There is an official documentation on how to fix this compatibility issue by making the “global” STS endpoint “Valid in all AWS Regions”.
If you do a lot of AWS API calls, it’s probably worth to consider the new default of AWS and to try the “regional” STS endpoints: “AWS recommends using Regional AWS STS endpoints instead of the global endpoint to reduce latency, build in redundancy, and increase session token validity.” This is already supported in the CLI, too.
Many years ago I wrote the library popen_noshell which improves the speed of the popen() call significantly. It seems that now there is a standard and very efficient way to achieve the same. Use the posix_spawn() call. Its interface is a bit grumpy and complicated, but it can’t be very simple after all, because posix_spawn() provides both great efficiency and lots of flexibility.
UPDATE: Here are some benchmarks for posix_spawn().
Let us first examine the different ways of spawning a process on Linux 4.10. Here are the different implementations of the following functions:
posix_spawn(): implemented by using clone(); no native Linux kernel syscall, yet
In the latest versions of the GNU libc, posix_spawn() uses a clone() call which is equivalent to the vfork() arguments of clone(). Therefore, a logical question pops up – why not use vfork() directly. “The problem are the atfork handlers which can be registered. In the child process they can modify the address space.”
Of course, it would be best if posix_spawn() was implemented as a system call in the Linux kernel. Then we wouldn’t need to depend on the GNU libc implementations, which by the way differ with the different versions of glibc. Additionally, the Linux kernel could spawn processes even faster.
The current implementation of posix_spawn() in the GNU libc is basically a vfork() with a limited, safe set of functions which can be executed inside the vfork()’ed child. When using vfork(), the child shares the memory and the stack of the parent process, so we need to be extra careful indeed. There are plenty of warnings in the man pages about the usage of vfork().
I am glad that my implementation and this of the GNU libc guys is very similar. They did a better job though, because they handle a few corner cases like custom signal handlers in the parent, etc. It’s worth to review the comments and the source code of the patch which introduces the new, very efficient posix_spawn() implementation in the GNU libc.
The above patch got into mainstream with glibc 2.24 on 2016-08-05.
When glibc 2.24 gets into the most mainstream Linux distributions, we can start to use posix_spawn() which should be as efficient as my popen_noshell implementation.
P.S. If you want to read even more technical details about the *fork() calls, try this and this pages.
$ PYTHONIOENCODING=utf8 aws s3 ls --recursive s3://youtube-mp3.famzah/ | tee | grep 4185710
2016-10-30 08:08:49    4185710 mp3/Youtube/Аналгин - Тя беше ангел-BF6KuR8vWN0.mp3
How to convert all stored S3 objects to another Storage Class
As already explained, the Storage Class cannot be set on a per-bucket basis. It must be specified with each upload operation in your client.
The migration procedure is already documented at the AWS CLI project. Here are the commands to check the current Storage Class of all objects in an S3 bucket, and how to convert them to a different Storage Class:
# all our S3 objects are using the "Standard" Storage Class
$ aws s3api list-objects --bucket youtube-mp3.famzah | grep StorageClass | sort | uniq -c
749  "StorageClass": "STANDARD"

# convert without re-uploading the objects from your computer
aws s3 cp --recursive --storage-class STANDARD_IA s3://youtube-mp3.famzah/ s3://youtube-mp3.famzah/

# all our S3 objects are now using the "Standard-Infrequent" Storage Class
$ aws s3api list-objects --bucket youtube-mp3.famzah | grep StorageClass | sort | uniq -c
749  "StorageClass": "STANDARD_IA"
The Internet ecosystem and technologies advanced so much lately that you can rebuild an entire business from scratch in a few hours of coding and at pretty acceptable costs. I’m referring to the dynamic DNS (aka. DDNS or DynDNS) service which was a hit a few years back. It took me less than a hundred lines of code to create a simple dynamic DNS using AWS Route 53. The AWS API and backend provide the DNS service, while the free service “ipify” lets you look up your real remote IP address. While this solution is not free as speech, it’s free as beer and costs less than a dollar per month.