/contrib/famzah

Enthusiasm never stops


Leave a comment

Proxy SSH traffic using Cloudflare Tunnels

Long story short, Cloudflare Tunnel started as a network service which lets you expose a web server with private IP address to the public Internet. This way you don’t have to punch a hole in your firewall infrastructure, in order to have inbound access to the server. There are additional benefits like the fact that nobody knows the real IP address of your server, they can’t DDoS you by sending malicious traffic, etc.

Today I was pleasantly surprised to discover that Cloudflare Tunnels can be used for SSH traffic as well. It’s true that most machines with an SSH server have public IP addresses. But think about the time when you want to access the Linux laptop or workstation of a relative, so that you can remotely control their desktop, in order to help them out. Modern Linux distros all provide remote desktop functionality but the question is how do you get direct network access to the Linux workstation.

If you can connect via SSH to a remote machine without a public IP address, then you can set up SSH port forwarding, in order to connect to their remote desktop local service, too.

Here is what you have to execute at the remote machine to which you want to connect:

$ wget https://github.com/cloudflare/cloudflared/releases/latest/download/cloudflared-linux-amd64
$ chmod +x cloudflared-linux-amd64 
$ ./cloudflared-linux-amd64 tunnel --url ssh://localhost:22

2023-03-04T20:51:16Z INF Thank you for trying Cloudflare Tunnel. Doing so, without a Cloudflare account, is a quick way to experiment and try it out. However, be aware that these account-less Tunnels have no uptime guarantee. If you intend to use Tunnels in production you should use a pre-created named tunnel by following: https://developers.cloudflare.com/cloudflare-one/connections/connect-apps
2023-03-04T20:51:16Z INF Requesting new quick Tunnel on trycloudflare.com...
2023-03-04T20:51:20Z INF +--------------------------------------------------------------------------------------------+
2023-03-04T20:51:20Z INF |  Your quick Tunnel has been created! Visit it at (it may take some time to be reachable):  |
2023-03-04T20:51:20Z INF |  https://statistics-feel-icon-applies.trycloudflare.com                                    |
2023-03-04T20:51:20Z INF +--------------------------------------------------------------------------------------------+

When you have the URL “statistics-feel-icon-applies.trycloudflare.com” (which changes with every quick Cloudflare tunnel execution), you have to do the following on your machine (documentation is here):

$ wget https://github.com/cloudflare/cloudflared/releases/latest/download/cloudflared-linux-amd64
$ chmod +x cloudflared-linux-amd64 

$ vi ~/.ssh/config # and then add the following
Host home.server
	ProxyCommand /home/famzah/cloudflared-linux-amd64 access ssh --hostname statistics-feel-icon-applies.trycloudflare.com

$ ssh root@home.server 'id ; hostname' # try the connection

uid=0(root) gid=0(root) groups=0(root)
home-server

The quick Cloudflare Tunnels are free and don’t require that you have an account with Cloudflare. What a great ad-hoc replacement of VPN networks! On Linux this network infrastructure lets you replace Teamviewer, AnyDesk, etc. with a free secure remote desktop solution.


Leave a comment

How to reliably get the system time zone on Linux?

If you want to get the time zone abbreviation, use the following command:

date +%Z

If you want the full time zone name, use the following command instead:

timedatectl show | grep ^Timezone= | perl -pe 's/^Timezone=(\S+)$/$1/'

There are other methods for getting the time zone. But they depend either on the environment variable $TZ (which may not be set), or on the statically configured “/etc/timezone” file which might be out of sync with the system time zone file “/etc/localtime”.

It’s important to note that the Linux system utilities reference the “/etc/localtime” file (not “/etc/timezone”) when working with the system time. Here is a proof:

$ strace -e trace=file date
execve("/bin/date", ["date"], 0x7ffda462e360 /* 67 vars */) = 0
access("/etc/ld.so.preload", R_OK) = -1 ENOENT (No such file or directory)
openat(AT_FDCWD, "/etc/ld.so.cache", O_RDONLY|O_CLOEXEC) = 3
openat(AT_FDCWD, "/lib/x86_64-linux-gnu/libc.so.6", O_RDONLY|O_CLOEXEC) = 3
openat(AT_FDCWD, "/usr/lib/locale/locale-archive", O_RDONLY|O_CLOEXEC) = 3
openat(AT_FDCWD, "/etc/localtime", O_RDONLY|O_CLOEXEC) = 3
Sat 04 Feb 2023 10:33:35 AM EET
+++ exited with 0 +++

The “/etc/timezone” file is a static helper that is set up when “/etc/localtime” is configured. Typically, “/etc/localtime” and “/etc/timezone” are in sync so it shouldn’t matter which one you query. However, I prefer to use the source of truth.

DNS icon by PRchecker


Leave a comment

Can your local NFS connections get broken by your external Internet connection?

Long story short: Yes! A flaky Internet connection to the outside world can make your local NFS client-server connections unusable. Even when they run on a dedicated storage network using dedicated switches and cables. This is a tale of dependencies, wrong assumptions, desperate restart of services, the butterfly effect and learning something new.

The company I work for operates 1000+ production servers in three data centers around the globe. This all started after a planned, trivial mass-restart of some internal services which are used by the online Control Panel. A couple of minutes after the restarts, the support team alarmed me that the Backup section of the Control Panel is not working. I acted as a typical System Administrator and just tried if the NFS backups are accessible from an SSH console. They were. So I concluded that most probably it wasn’t something with the NFS service but it was a problem caused by the restart of the internal services which keep the Control Panel running.

So we called a system developer to look into this. In the meantime I discovered by tests that the issue is limited only to one of our data centers. This raised an eyebrow but still with no further debug info and with everything working under the SSH console, I had to wait for input from the system development team. About an hour later they came up with a super simple reproducer:

perl -e 'use Path::Tiny; print path("/nfs/backup/somefile")->slurp;'

strace() shown that this hung on “flock(LOCK_SH)”. OMG! So it was a problem with the System Administrators’ systems after all. My previous test was to simply browse and read the files, and it didn’t occur to me to try file locking. I didn’t even know that this was used by the Control Panel. It turns out to be some (weird) default by Path::Tiny. A couple of minutes later I simplified the reproducer even more to just the following:

flock --shared /nfs/backup/somefile true

This also hung on “flock(LOCK_SH)”. Only in the USA data center. The backup servers were complaining about the following:

statd: server rpc.statd not responding, timed out
lockd: cannot monitor %server-XXX-of-ours%

The NFS clients were reporting:

lockd: server %backup-IP% not responding, still trying
xs_tcp_setup_socket: connect returned unhandled error -107

Right! So it’s the “rpc.statd” which just died! On both of our backup servers, simultaneously? Hmm… I raised the eyebrow even more. All servers had weeks of uptime, no changes at the time when the incident started, etc. Nothing suspicious caused by activity from any of our teams. Nevertheless, it doesn’t hurt to restart the NFS services. So I did it — restarted the backup NFS services (two times), the client NFS services for one of the production servers, unmounted and mounted the NFS directories. Nothing. Finally, I restarted the backup servers because there was a “[lockd]” kernel process hung in “D” state. After all it is possible that two backup servers with the same uptime get the same kernel bug at the same time…

The restart of the server machines fixed it! Pfew! Yet another unresolved mystery fixed by restart. Wait! Three minutes later the joy was gone because the Control Panel Backup section started to be sluggish again. The production machine where I was testing was intermittendly able to use the NFS locking.

2h30m elapsed already. Now it finally occurred to me that I need to pay closer attention to what the “rpc.statd” process was doing. To my surprise strace() shown that the process was waiting for 5+ seconds for some… DNS queries! It was trying to resolve “a.b.c.x.in-addr.arpa” and was timing out. The request was going to the local DNS cache server. The global DNS resolvers 8.8.8.8 and 1.1.1.1 were working properly and immediately returned “NXDOMAIN” for this DNS query. So I configured them on the backup servers and the NFS connections got much more stable. Still not perfect though.

The situation started to clear up. The NFS client was connecting to the NFS server. The server then tried to resolve the client’s private IP address to a hostname but was failing and this DNS failure was taking too many seconds. The reverse DNS zone for this private IPv4 network is served by the DNS servers “blackhole-1.iana.org” and “blackhole-2.iana.org”. Unfortunately, our upstream Internet provider was experiencing a problem and the connection to those DNS servers was failing with “Time to live exceeded” because of a network loop.

But why the NFS locking was still a bit sluggish after I fixed the NFS servers? It turned out that the “rpc.statd” of the NFS clients also does DNS resolve for the IP address of the NFS server.

30 minutes later I blacklisted the whole “x.in-addr.arpa” DNS zone for the private IPv4 network in all our local DNS resolvers and now they were replying with SERVFAIL immediately. The NFS locking started to work fast again and the Online Control panels were responding as expected.

Case closed. In three hours. Could have been done must faster – if I only knew NFS better, our NFS usage pattern and if I didn’t jump into the wrong assumptions. I’m still happy that I got to the root cause and have the confidence that the service is completely fixed for our customers.


Leave a comment

Debug the usage of anonymously shared memory regions

PHP-FPM keeps a shared Opcache memory between the parent process and all its child processes in a pool. The idea is to compile source code once and then reuse it in all child processes directly as byte code. This is efficient but as a System administrator I recently stumbled across a problem – how to find out the real memory usage by the Opcache in the operating system?

I thought a simple “ps” list would reveal the memory usage because it would be accounted to the parent process, because the parent process created the anonymously shared mmap() region. Linux doesn’t work this way. In order to debug this easily, I created a simple program which does the following:

  • The parent process creates a shared anonymous memory region using mmap() with a size of 2000 MB. The parent process does not use the memory region in any way. It doesn’t change any data in it.
  • Two child processes are fork()’ed and then:
    • The first process writes 500 MB of data in the beginning of shared memory region passed by the parent process.
    • The second process writes 1000 MB of data in the beginning of the shared memory region passed by the parent process.

Here is how the process list looks like:

USER PID %CPU %MEM VSZ RSS TTY STAT START TIME COMMAND
famzah 9256 0.0 0.0 2052508 816 pts/15 S+ 18:00 0:00 ./a.out # parent
famzah 9257 10.7 10.1 2052508 512008 pts/15 S+ 18:00 0:01 \_ ./a.out # child 1
famzah 9258 29.0 20.2 2052508 1023952 pts/15 S+ 18:00 0:03 \_ ./a.out # child 2
famzah@vbox64:~$ free -m
total used free shared buff/cache available
Mem: 4940 549 1943 1012 2447 3097
view raw ps output hosted with ❤ by GitHub

A quick explanation of this process list snapshot:

  • VSZ (virtual size) of the parent and child processes is 2000 MB because the parent process has allocated 2000 MB of anonymous memory using mmap(). No additional allocations were made by the child processes as they were passed a reference to the anonymously shared memory in the parent process. Therefore the virtual memory footprint of all processes is the same.
  • RSS (resident set size, or simply “the real usage”) is:
    • Almost none for the parent process because it never used any memory. It only “requested” the memory block by mmap().
    • 500 MB for the first child processes because it wrote 500 MB of data at the beginning of the shared memory region.
    • 1000 MB for the second child processes because it wrote 1000 MB of data at the beginning of the shared memory region.
  • The “free -m” command shows that 1012 MB of anonymously shared memory is being used.

So far things seem kind of logical. We can roughly determine the real usage of the shared memory region by looking at the child processes. This however is also not really true because if they write at completely different regions in the anonymous memory, we would need to sum their usage. If they write to the very same memory region, we need to look at the max() value.

The pmap command doesn’t provide any additional information and shows the same values that we see in the “ps” output:

famzah@vbox64:~$ pmap -XX 9256
9256: ./a.out
Address Perm Offset Device Inode Size KernelPageSize MMUPageSize Rss Pss Shared_Clean Shared_Dirty Private_Clean Private_Dirty Referenced Anonymous LazyFree AnonHugePages ShmemPmdMapped Shared_Hugetlb Private_Hugetlb Swap SwapPss Locked VmFlagsMapping
7f052ea9b000 rw-s 00000000 00:05 733825 2048000 4 4 0 0 0 0 0 0 0 0 0 0 0 0 0 0 0 0 rd wr sh mr mw me ms sd zero (deleted)
famzah@vbox64:~$ pmap -XX 9257
9257: ./a.out
Address Perm Offset Device Inode Size KernelPageSize MMUPageSize Rss Pss Shared_Clean Shared_Dirty Private_Clean Private_Dirty Referenced Anonymous LazyFree AnonHugePages ShmemPmdMapped Shared_Hugetlb Private_Hugetlb Swap SwapPss Locked VmFlagsMapping
7f052ea9b000 rw-s 00000000 00:05 733825 2048000 4 4 512000 256000 0 512000 0 0 512000 0 0 0 0 0 0 0 0 0 rd wr sh mr mw me ms sd zero (deleted)
famzah@vbox64:~$ pmap -XX 9258
9258: ./a.out
Address Perm Offset Device Inode Size KernelPageSize MMUPageSize Rss Pss Shared_Clean Shared_Dirty Private_Clean Private_Dirty Referenced Anonymous LazyFree AnonHugePages ShmemPmdMapped Shared_Hugetlb Private_Hugetlb Swap SwapPss Locked VmFlagsMapping
7f052ea9b000 rw-s 00000000 00:05 733825 2048000 4 4 1024000 768000 0 512000 512000 0 1024000 0 0 0 0 0 0 0 0 0 rd wr sh mr mw me ms sd zero (deleted)
view raw pmap output hosted with ❤ by GitHub

Things get even more messy when the child processes terminate (and get replaced by new ones which never touched the shared anonymous memory). Here is how the process list looks like:

USER PID %CPU %MEM VSZ RSS TTY STAT START TIME COMMAND
famzah 9256 0.0 0.0 2052508 816 pts/15 S+ 18:00 0:00 ./a.out # parent
famzah@vbox64:~$ free -m
total used free shared buff/cache available
Mem: 4940 549 1943 1012 2447 3097
view raw ps output hosted with ❤ by GitHub

The RSS (resident set size, or simply “the real usage”) of the parent process continues to show no usage. But the anonymous memory region is actually used because the child processes wrote data in it. And the region is not automatically free()’d, because the parent process is still alive. The “free -m” command clearly shows that there are 1000 MB of data stored in anonymous shared memory.

How can we reliably find out the memory usage of the anonymous shared region and account it to a given process?

We will look at /proc/[pid]/maps:

A file containing the currently mapped memory regions and their access permissions. See mmap(2) for some further information about memory mappings.

If the pathname field is blank, this is an anonymous mapping as obtained via mmap(2). There is no easy way to coordinate this back to a process’s source, short of running it through gdb(1), strace(1), or similar.

Wikipedia gives the following additional information:

When “/dev/zero” is memory-mapped, e.g., with mmap(), to the virtual address space, it is equivalent to using anonymous memory; i.e. memory not connected to any file.

Now we know how to find out the virtual address of the anonymously memory-mapped region. Here I demostrate two different ways of obtaining the address:

famzah@vbox64:~$ cat /proc/9256/maps | grep /dev/zero
7f052ea9b000-7f05aba9b000 rw-s 00000000 00:05 733825 /dev/zero (deleted)
famzah@vbox64:~$ ls -la /proc/9256/map_files/ | grep /dev/zero # same region of 7f052ea9b000-7f05aba9b000
lrw——- 1 famzah famzah 64 Nov 11 18:21 7f052ea9b000-7f05aba9b000 -> '/dev/zero (deleted)'

The man page of tmpfs gives further insight:

An internal shared memory filesystem is used for […] shared anonymous mappings (mmap(2) with the MAP_SHARED and MAP_ANONYMOUS flags).

The amount of memory consumed by all tmpfs filesystems is shown in the Shmem field of /proc/meminfo and in the shared field displayed by free(1).

We verify that the memory-mapped region is a “tmpfs” file:

famzah@vbox64:~$ sudo stat -Lf /proc/9256/map_files/7f052ea9b000-7f05aba9b000
File: "/proc/9256/map_files/7f052ea9b000-7f05aba9b000"
ID: 0 Namelen: 255 Type: tmpfs

💚 We can then finally get the real memory usage of this shared anonymous memory block in terms of VSS (virtual memory size) and RSS (resident set size, or simply “the real usage”):

# stat doesn't give us the real usage, only the virtual
famzah@vbox64:~$ sudo stat -L /proc/9256/map_files/7f052ea9b000-7f05aba9b000
File: /proc/9256/map_files/7f052ea9b000-7f05aba9b000
Size: 2097152000 Blocks: 2048000 IO Block: 4096 regular file
Device: 5h/5d Inode: 733825 Links: 0
Access: (0777/-rwxrwxrwx) Uid: ( 1000/ famzah) Gid: ( 1000/ famzah)
# VSS (virtual memory size)
famzah@vbox64:~$ sudo du –apparent-size -BM -D /proc/9256/map_files/7f052ea9b000-7f05aba9b000
2000M /proc/9256/map_files/7f052ea9b000-7f05aba9b000
# RSS (resident set size, or simply "the real usage")
famzah@vbox64:~$ sudo du -BM -D /proc/9256/map_files/7f052ea9b000-7f05aba9b000
1000M /proc/9256/map_files/7f052ea9b000-7f05aba9b000

Since we have access to the memory region as a file, we can even read this memory mapped region:

famzah@vbox64:~$ sudo cat /proc/9256/map_files/7f052ea9b000-7f05aba9b000 | wc -c
2097152000


5 Comments

posix_spawn() performance benchmarks and usage examples

The glibc library has an efficient posix_spawn() implementation since glibc version 2.24 (2016-08-05). I have awaited this feature for a long time.

TL;DR: posix_spawn() in glibc 2.24+ is really fast. You should replace the old system() and popen() calls with posix_spawn().

Today I ran all benchmarks of the popen_noshell() library, which basically emulates posix_spawn(). Here are the results:

Test Uses pipes User CPU System CPU Total CPU Slower with
vfork() + exec(), standard Libc No 7.4 1.6 9.0
the new noshell, default clone(), compat=1 Yes 7.7 2.1 9.7 8%
the new noshell, default clone(), compat=0 Yes 7.8 2.0 9.9 9%
posix_spawn() + exec() no pipes, standard Libc No 9.4 2.0 11.5 27%
the new noshell, posix_spawn(), compat=0 Yes 9.6 2.7 12.3 36%
the new noshell, posix_spawn(), compat=1 Yes 9.6 2.7 12.3 37%
fork() + exec(), standard Libc No 40.5 43.8 84.3 836%
the new noshell, debug fork(), compat=1 No 41.6 45.2 86.8 863%
the new noshell, debug fork(), compat=0 No 41.6 45.3 86.9 865%
system(), standard Libc No 67.3 48.1 115.4 1180%
popen(), standard Libc Yes 70.4 47.1 117.5 1204%

The fastest way to run something externally is to call vfork() and immediately exec() after it. This is the best solution if you don’t need to capture the output of the command, nor you need to supply any data to its standard input. As you can see, the standard system() call is about 12 times slower in performing the same operation. The good news is that posix_spawn() + exec() is almost as fast as vfork() + exec(). If we don’t care about the 27% slowdown, we can use the standard posix_spawn() interface.

It gets more complicated and slower if you want to capture the output or send data to stdin. In such a case you have to duplicate stdin/stdout descriptors, close one of the pipe ends, etc. The popen_noshell.c source code gives a full example of all this work.

We can see that the popen_noshell() library is still the fastest option to run an external process and be able to communicate with it. The command popen_noshell() is just 8% slower than the absolute ideal result of a simple vfork() + exec().

There is another good news — posix_spawn() is also very efficient! It’s a fact that it lags with 36% behind the vfork() + exec() marker, but still it’s 12 times faster than the popen() old-school glibc alternative. Using the standard posix_spawn() makes your source code easier to read, better supported for bugs by the mainstream glibc library, and you have no external library dependencies.

The replacement of system() using posix_spawn() is rather easy as we can see in the “popen-noshell/performance_tests/fork-performance.c” function posix_spawn_test():

# the same as system() but using posix_spawn() which is 12 times faster
void posix_spawn_test() {
	pid_t pid;
	char * const argv[] = { "./tiny2" , NULL };

	if (posix_spawn(&pid, "./tiny2", NULL, NULL, argv, environ) != 0) {
		err(EXIT_FAILURE, "posix_spawn()");
	}

	parent_waitpid(pid);
}

If you want to communicate with the external process, there are a few more steps which you need to perform like creating pipes, etc. Have a look at the source code of “popen_noshell.c“. If you search for the string “POPEN_NOSHELL_MODE”, you will find two alternative blocks of code — one for the standard way to start a process and manage pipes in C, and the other block will show how to perform the same steps using the posix_spawn() family functions.

Please note that posix_spawn() is a completely different implementation than system() or popen(). If it’s not safe to use the faster way, posix_spawn() may fall back to the slow fork().


Leave a comment

posix_spawn() on Linux

Many years ago I wrote the library popen_noshell which improves the speed of the popen() call significantly. It seems that now there is a standard and very efficient way to achieve the same. Use the posix_spawn() call. Its interface is a bit grumpy and complicated, but it can’t be very simple after all, because posix_spawn() provides both great efficiency and lots of flexibility.

UPDATE: Here are some benchmarks for posix_spawn().

Let us first examine the different ways of spawning a process on Linux 4.10. Here are the different implementations of the following functions:

  • fork(): _do_fork(SIGCHLD, 0, 0, NULL, NULL, 0);
  • vfork(): _do_fork(CLONE_VFORK | CLONE_VM | SIGCHLD, 0, 0, NULL, NULL, 0);
  • clone(): _do_fork(clone_flags, newsp, 0, parent_tidptr, child_tidptr, tls);
  • posix_spawn(): implemented by using clone(); no native Linux kernel syscall, yet

In the latest versions of the GNU libc, posix_spawn() uses a clone() call which is equivalent to the vfork() arguments of clone(). Therefore, a logical question pops up – why not use vfork() directly. “The problem are the atfork handlers which can be registered. In the child process they can modify the address space.”

Of course, it would be best if posix_spawn() was implemented as a system call in the Linux kernel. Then we wouldn’t need to depend on the GNU libc implementations, which by the way differ with the different versions of glibc. Additionally, the Linux kernel could spawn processes even faster.

The current implementation of posix_spawn() in the GNU libc is basically a vfork() with a limited, safe set of functions which can be executed inside the vfork()’ed child. When using vfork(), the child shares the memory and the stack of the parent process, so we need to be extra careful indeed. There are plenty of warnings in the man pages about the usage of vfork().

I am glad that my implementation and this of the GNU libc guys is very similar. They did a better job though, because they handle a few corner cases like custom signal handlers in the parent, etc. It’s worth to review the comments and the source code of the patch which introduces the new, very efficient posix_spawn() implementation in the GNU libc.

The above patch got into mainstream with glibc 2.24 on 2016-08-05.

When glibc 2.24 gets into the most mainstream Linux distributions, we can start to use posix_spawn() which should be as efficient as my popen_noshell implementation.

P.S. If you want to read even more technical details about the *fork() calls, try this and this pages.


5 Comments

OpenSSH ciphers performance benchmark (update 2015)

It’s been five years since the last OpenSSH ciphers performance benchmark. There are two fundamentally new things to consider, which also gave me the incentive to redo the tests:

  • Since OpenSSH version 6.7 the default set of ciphers and MACs has been altered to remove unsafe algorithms. In particular, CBC ciphers and arcfour* are disabled by default. This has been adopted in Debian “Jessie”.
  • Modern CPUs have hardware acceleration for AES encryption.

I tested five different platforms having CPUs with and without AES hardware acceleration, different OpenSSL versions, and running on different platforms including dedicated servers, OpenVZ and AWS.

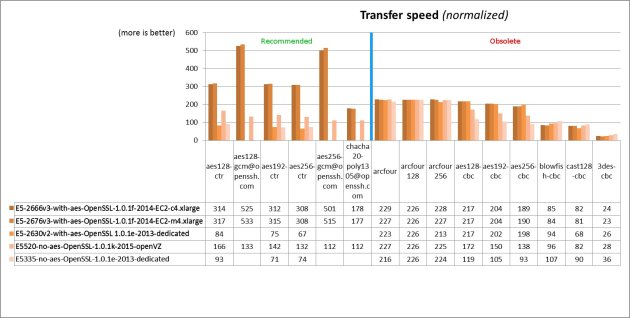
Since the processing power of each platform is different, I had to choose a criteria to normalize results, in order to be able to compare them. This was a rather confusing decision, and I hope that my conclusion is right. I chose to normalize against the “arcfour*”, “blowfish-cbc”, and “3des-cbc” speeds, because I doubt it that their implementation changed over time. They should run equally fast on each platform because they don’t benefit from the AES acceleration, nor anyone bothered to make them faster, because those ciphers are meant to be marked as obsolete for a long time.

A summary chart with the results follow:
openssh-ciphers-performance-2015-chart

You can download the raw data as an Excel file. Here is the command which was run on each server:

# uses "/root/tmp/dd.txt" as a temporary file!
for cipher in aes128-cbc aes128-ctr aes128-gcm@openssh.com aes192-cbc aes192-ctr aes256-cbc aes256-ctr aes256-gcm@openssh.com arcfour arcfour128 arcfour256 blowfish-cbc cast128-cbc chacha20-poly1305@openssh.com 3des-cbc ; do
	for i in 1 2 3 ; do
		echo
		echo "Cipher: $cipher (try $i)"
		
		dd if=/dev/zero bs=4M count=1024 2>/root/tmp/dd.txt | pv --size 4G | time -p ssh -c "$cipher" root@localhost 'cat > /dev/null'
		grep -v records /root/tmp/dd.txt
	done
done

We can draw the following conclusions:

  • Servers which run a newer CPU with AES hardware acceleration can enjoy the benefit of (1) a lot faster AES encryption using the recommended OpenSSH ciphers, and (2) some AES ciphers are now even two-times faster than the old speed champion, namely “arcfour”. I could get those great speeds only using OpenSSL 1.0.1f or newer, but this may need more testing.
  • Servers having a CPU without AES hardware acceleration still get two-times faster AES encryption with the newest OpenSSH 6.7 using OpenSSL 1.0.1k, as tested on Debian “Jessie”. Maybe they optimized something in the library.

Test results may vary (a lot) depending on your hardware platform, Linux kernel, OpenSSH and OpenSSL versions.


Leave a comment

“iperf” and “iftop” accuracy

While working on my latest pet project which involved 10 GigE transfers, I noticed a significant difference between the results shown by “iperf” and “iftop“. A fellow blogger also noticed this discrepancy. In order to get to the bottom of this, I did some additional tests using different MTU sizes, and observing the output of “iperf”, “iftop”, “iptraf”, and the raw Linux network device counters as seen by “ifconfig”.

The tests results are summarized in an online spreadsheet: https://goo.gl/MvJC8K
iperf vs. iftop vs. iptraf vs. raw stats - spreadsheet - preview

Some notes about each application:

  • iperf – this tool measures the TCP performance, as per documentation; therefore it counts the useful payload in a TCP/IP transfer; this is layer4 in the OSI model
  • iftop – this tool counts all IP packets, as per documentation; my tests show that it also operates on layer4, just as “iperf”, because ARP traffic (on layer3) is not counted at all; the fact that “iftop” cares about connections+ports also suggests that it operates at layer4
  • iptraf – this tool seems to be too old now, and its results were off by a multiple of 4 to 5
  • ifconfig – shows the most low-level statistics, namely bytes that passed as RX or TX through the network device; the most trusted source of performance data

We notice that both “iperf” and “iftop” measure the useful payload data that we can transfer per second. Since all OSI layers have some overhead, let’s take a look at what theory says about bandwidth efficiency in Ethernet:

  • with a standard MTU frame of 1500 bytes, we get 94.93% efficiency (5.07% overhead)
  • with a jumbo MTU frame of 9000 bytes, we get 99.14% efficiency (0.86% overhead)

Those numbers correspond very closely with the results shown by “iperf”.

It’s only “iftop” which differs a lot. Analysis of its source code reveals the reason for this and how we must interpret the displayed results:

#
# ui.c
#

void ui_print() {
...
    mvaddstr(y, COLS - 8 * HISTORY_DIVISIONS - 8, "rates:");

    draw_totals(&totals);
}

void draw_totals(host_pair_line* totals) {
    for(j = 0; j < HISTORY_DIVISIONS; j++) {
        readable_size((totals->sent[j] + totals->recv[j]) , buf, 10, 1024, options.bandwidth_in_bytes);
...
}

#
# ui_common.c
#

/*
 * Format a data size in human-readable format
 */
void readable_size(float n, char* buf, int bsize, int ksize, int bytes) {
    float size = 1;
...
    while(1) {
      size *= ksize;
...
        snprintf(buf, bsize, " %4.2f%s", n / size, bytes ? unit_bytes[i] : unit_bits[i]);

The authors of “iftop” decided to round to Gigibit (multiple of 1024), instead of the more common Gigabit (multiple of 1000). This makes the difference by “iftop” bigger as the transfer rate gets higher. For Gigabit the difference is 7%.

Once the “iftop” values are converted from Gigibit to Gigabit, they also match the results by “iperf” and the raw Linux network device counters.


5 Comments

Linux md-RAID scalability on a 10 Gigabit network

The question for today is – does Linux md-RAID scale to 10 Gbit/s?

I wanted to build a proof of concept for a scalable, highly available, fault tolerant, distributed block storage, which utilizes commodity hardware, runs on a 10 Gigabit Ethernet network, and uses well-tested open-source technologies. This is a simplified version of Ceph. The only single point of failure in this cluster is the client itself, which is inevitable in any solution.

Here is an overview diagram of the setup:
Linux md-RAID scalability on a 10 Gigabit network

My test lab is hosted on AWS:

  • 3x “c4.8xlarge” storage servers
    • each of them has 5x 50 GB General Purpose (SSD) EBS attached volumes which provide up to 160 MiB/s and 3000 IOPS for extended periods of time; practical tests shown 100 MB/s sustained sequential read/write performance per volume
    • each EBS volume is managed via LVM and there is one logical volume with size 15 GB
    • each 15 GB logical volume is being exported by iSCSI to the client machine
  • 1x “c4.8xlarge” client machine
    • the client machine initiates an iSCSI connection to each single 15 GB logical volume, and thus has 15 identical iSCSI block devices (3 storage servers x 5 block devices = 15 block devices)
    • to achieve a 3x replication factor, the block devices from each storage server are grouped into 5x mdadm software RAID-1 (mirror) devices; each RAID-1 device “md1” to “md5” contains three disks from a different storage server, so that if one or two of the storage servers fail, this won’t affect the operation of the whole RAID-1 device
    • all RAID-1 devices “md1” to “md5” are grouped into a single RAID-0 (stripe), in order to utilize the full bandwidth of all devices into a single block device, namely the “md99” RAID-0 device, which also combines the size capacity of all “md1” to “md5” devices and it equals to 75 GB
  • 10 Gigabit network in a VPC using Jumbo frames
  • the storage servers and the client machine were limited on boot to 4 CPUs and 2 GB RAM, in order to minimize the effect of the Linux disk cache
  • only sequential and random reading were benchmarked
  • Linux md RAID-1 (mirror) does not read from all underlying disks by default, so I had to create a RAID-1E (mirror) configuration; more info here and here; the “mdadm create” options follow: --level=10 --raid-devices=3 --layout=o3 Continue reading