/contrib/famzah

Enthusiasm never stops


Leave a comment

Amazon EFS benchmarks

The Amazon Elastic File System (EFS) is a very intriguing storage product. It provides simple, scalable, elastic file storage for use on an EC2 virtual machine. The file system can be mounted over NFS at one or more EC2 machines simultaneously, and it also supports file locking.

Here are some important facts which I found out while doing my tests:

  • I/O operations per second (IOPS) are not the same metric that we’re used to measure when dealing with block devices like HDD or SSD disks. When working with EFS, we measure the NFS I/O operations per second. These correspond 1:1 to the read() or write() system calls that your applications make.
  • The size of the issued I/O requests are another very important metric for EFS. This is the real bytes transfer between your EC2 instance and the NFS server.
  • Therefore, we’re limited by both the NFS I/O requests per second, and the total transferred bytes for those NFS I/O per second.
  • The EFS performance and EFS limits documentation pages give a lot of insight. You have to monitor your EFS metrics using CloudWatch.
  • NFS I/O requests smaller than 4096 bytes are accounted as 4096 bytes. Regardless if you request 1 bytes, 1000 bytes, or 4096 bytes, you will get 4096 bytes accounted. Once you request more than 4096 bytes, they are accounted correctly.
  • You need more than one reader/writer thread or program, in order to achieve the full IOPS potential. One writer thread in my tests did 130 op/s, while 20 writer threads did 1500 op/s, for example.
  • The documentation says: “In General Purpose mode, there is a limit of 7000 file system operations per second. This operations limit is calculated for all clients connected to a single file system”. Our tests confirm this — we could do 3500 reading or 3000 writing operations per second.
  • CloudWatch has different aggregation functions for the *IOBytes metrics: min/max/average; sum; count. They represent different aspects of your EFS metrics, namely: the min/max/average IO operation size in bytes; the total transferred bytes in a minute (you need to divide to 60 to get the “per second” value); the total operations in a minute (you need to divide to 60 to get the “per second” value).
  • The CloudWatch EFS metrics “DataReadIOBytes” and “DataWriteIOBytes” reflect exactly what we see on the Linux system for “kB/s” and “ops/s” by the nfsiostat program. The transferred bytes reflect exactly the used bandwidth on the Linux network interfaces.
  • The “Metered size” in the AWS Console which is the same value as what you see by the “df” command is not updated in real-time. It could take more than an hour to reflect the real disk usage.
  • There is plenty of initial burst credit balance which lets you do some heavy I/O on your freshly created EFS file system. Our benchmark tests ran for hours with block sizes between 1 byte and 10k bytes, and we still had some positive burst credit balance left at the end.

I’m using the default NFS settings by the NFS mount helper provided in the “Amazon Linux 2” OS:

[root@ip-172-31-11-75 ~]# mount -t efs fs-7513e02c:/ /efs

[root@ip-172-31-11-75 ~]# mount
fs-7513e02c.efs.eu-central-1.amazonaws.com:/ on /efs type nfs4 (rw,relatime,vers=4.1,rsize=1048576,wsize=1048576,namlen=255,hard,proto=tcp,timeo=600,retrans=2,sec=sys,clientaddr=172.31.11.75,local_lock=none,addr=172.31.15.76)

The tests were performed using two “m4.xlarge” EC2 instances in the “eu-central” AWS region. This EC2 instance type provides “High” network performance.

The NFS I/O operations per second limits were tested using a simple C program which basically does the following:

fd = open(testfile, O_RDWR|O_DIRECT|O_SYNC);

while (1) {
  lseek(fd, SEEK_SET, 0);

  read(fd, buf, sizeof(buf));
  // or
  write(fd, buf, sizeof(buf));
}

I created 40 different files, so that I can run 40 different single benchmark programs on an EC2 instance – one for each file. This increases concurrency and lets the total throughput scale better.

Sequential writing and reading

Sequential writing and reading performed as expected – up to the “PermittedThroughput” limit shown in the CloudWatch metrics. In my case, for such a small EFS file system, the limit was 105 MB/s.

Writing: NFS I/O operations per second

Here are the results:

  • Writing from one EC2 instance using 1 byte, 1k bytes, or 10k bytes: regardless of the request size, we get up to 2000 IOPS. Typically the IOPS are between 1400 and 1700.
  • Writing from two EC2 instances using 1 byte, 1k bytes, or 10k bytes: regardless of the request size, we get up to 3000 IOPS in total which are equally spread across the two EC2 instances.
  • The “PercentIOLimit” CloudWatch metric shows 84% when we do 2880 ops/s, for example. Therefore, the total IOPS limit for writing is about 3500 ops/s.
  • When doing only write() system calls with 1 byte data, only “DataWriteIOBytes” is accounted by EFS which is an advantage for us. A real block file system needs to read the block (usually 4k bytes), update 1 byte in it, and then write it back on disk. I feel like this needs additional testing with more random data, so test for yourself, too. Note that the minimum accounted request size in EFS is 4kB.

Reading: NFS I/O operations per second

Here are the results:

  • Reading from one EC2 instance using 1 byte or 10k bytes: regardless of the request size, we get up to 3500 IOPS. One EC2 instance is enough to saturate the EFS limit.
  • Reading from two EC2 instances using 1 byte or 10k bytes: regardless of the request size, we get up to 3500 IOPS in total which are equally spread across the two EC2 instances.
  • The “PercentIOLimit” CloudWatch metric shows 100% when we do 3500 ops/s. Therefore, the total IOPS limit for reading is 3500 ops/s.


52 Comments

C++ vs. Python vs. PHP vs. Java vs. Others performance benchmark (2016 Q3)

The benchmarks here do not try to be complete, as they are showing the performance of the languages in one aspect, and mainly: loops, dynamic arrays with numbers, basic math operations.

This is an improved redo of the tests done in previous years. You are strongly encouraged to read the additional information about the tests in the article.

Here are the benchmark results:

Language CPU time Slower than Language
version
Source
code
User System Total C++ previous
C++ (optimized with -O2) 0.899 0.053 0.951 g++ 6.1.1 link
Rust 0.898 0.129 1.026 7% 7% 1.12.0 link
Java 8 (non-std lib) 1.090 0.006 1.096 15% 6% 1.8.0_102 link
Python 2.7 + PyPy 1.376 0.120 1.496 57% 36% PyPy 5.4.1 link
C# .NET Core Linux 1.583 0.112 1.695 78% 13% 1.0.0-preview2 link
Javascript (nodejs) 1.371 0.466 1.837 93% 8% 4.3.1 link
Go 2.622 0.083 2.705 184% 47% 1.7.1 link
C++ (not optimized) 2.921 0.054 2.975 212% 9% g++ 6.1.1 link
PHP 7.0 6.447 0.178 6.624 596% 122% 7.0.11 link
Java 8 (see notes) 12.064 0.080 12.144 1176% 83% 1.8.0_102 link
Ruby 12.742 0.230 12.972 1263% 6% 2.3.1 link
Python 3.5 17.950 0.126 18.077 1800% 39% 3.5.2 link
Perl 25.054 0.014 25.068 2535% 38% 5.24.1 link
Python 2.7 25.219 0.114 25.333 2562% 1% 2.7.12 link

The big difference this time is that we use a slightly modified benchmark method. Programs are no longer limited to just 10 loops. Instead they run for 90 wall-clock seconds, and then we divide and normalize their performance as if they were running for only 10 loops. This way we can compare with the previous results. The benefit of doing the tests like this is that the startup and shutdown times of the interpreters should make almost no difference now. It turned out that the new method doesn’t significantly change the outcome compared to the previous benchmark runs, which is good as the old way of benchmarks seems also correct.

For the curious readers, the raw results also show the maximum used memory (RSS).

Brief analysis of the results:

  • Rust, which we benchmark for the first time, is very fast. 🙂
  • C# .NET Core on Linux, which we also benchmark for the first time, performs very well by being as fast as NodeJS and only 78% slower than C++. Memory usage peak was at 230 MB which is the same as Python 3.5 and PHP 7.0, and two times less than Java 8 and NodeJS.
  • NodeJS version 4.3.x got much slower than the previous major version 4.2.x. This is the only surprise. It turned out to be a minor glitch in the parser which was easy to fix. NodeJS 4.3.x is performing the same as 4.2.x.
  • Python and Perl seem a bit slower than before but this is probably due to the fact that C++ performed even better because of the new benchmark method.
  • Java 8 didn’t perform much faster as we expected. Maybe it gets slower as more and more loops are done, which also allocated more RAM.
  • Also review the analysis in the old 2016 tests for more information.

The tests were run on a Debian Linux 64-bit machine.

You can download the source codes, raw results, and the benchmark batch script at:
https://github.com/famzah/langs-performance

Update @ 2016-10-15: Added the Rust implementation. The minor versions of some languages were updated as well.
Update @ 2016-10-19: A redo which includes the NodeJS fix.
Update @ 2016-11-04: Added the C# .NET Core implementation.


47 Comments

C++ vs. Python vs. Perl vs. PHP performance benchmark (2016)

There are newer benchmarks: C++ vs. Python vs. PHP vs. Java vs. Others performance benchmark (2016 Q3)

The benchmarks here do not try to be complete, as they are showing the performance of the languages in one aspect, and mainly: loops, dynamic arrays with numbers, basic math operations.

This is a redo of the tests done in previous years. You are strongly encouraged to read the additional information about the tests in the article.

Here are the benchmark results:

Language CPU time Slower than Language
version
Source
code
User System Total C++ previous
C++ (optimized with -O2) 0.952 0.172 1.124 g++ 5.3.1 link
Java 8 (non-std lib) 1.332 0.096 1.428 27% 27% 1.8.0_72 link
Python 2.7 + PyPy 1.560 0.160 1.720 53% 20% PyPy 4.0.1 link
Javascript (nodejs) 1.524 0.516 2.040 81% 19% 4.2.6 link
C++ (not optimized) 2.988 0.168 3.156 181% 55% g++ 5.3.1 link
PHP 7.0 6.524 0.184 6.708 497% 113% 7.0.2 link
Java 8 14.616 0.908 15.524 1281% 131% 1.8.0_72 link
Python 3.5 18.656 0.348 19.004 1591% 22% 3.5.1 link
Python 2.7 20.776 0.336 21.112 1778% 11% 2.7.11 link
Perl 25.044 0.236 25.280 2149% 20% 5.22.1 link
PHP 5.6 66.444 2.340 68.784 6020% 172% 5.6.17 link

The clear winner among the script languages is… PHP 7. 🙂

Yes, that’s not a mistake. Apparently the PHP team did a great job! The rumor that PHP 7 is really fast confirmed for this particular benchmark test. You can also review the PHP 7 infographic by the Zend Performance Team.

Brief analysis of the results:

  • NodeJS got almost 2x faster.
  • Java 8 seems almost 2x slower.
  • Python has no significant change in the performance. Every new release is a little bit faster but overall Python is steadily 15x slower than C++.
  • Perl has the same trend as Python and is steadily 22x slower than C++.
  • PHP 5.x is the slowest with results between 47x to 60x behind C++.
  • PHP 7 made the big surprise. It is about 10x faster than PHP 5.x, and about 3x faster than Python which is the next fastest script language.

The tests were run on a Debian Linux 64-bit machine.

You can download the source codes, an Excel results sheet, and the benchmark batch script at:
https://github.com/famzah/langs-performance


5 Comments

OpenSSH ciphers performance benchmark (update 2015)

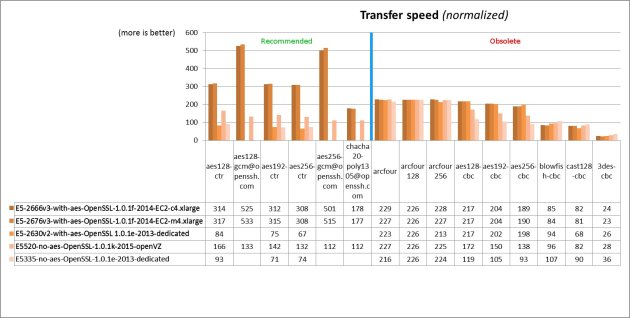
It’s been five years since the last OpenSSH ciphers performance benchmark. There are two fundamentally new things to consider, which also gave me the incentive to redo the tests:

  • Since OpenSSH version 6.7 the default set of ciphers and MACs has been altered to remove unsafe algorithms. In particular, CBC ciphers and arcfour* are disabled by default. This has been adopted in Debian “Jessie”.
  • Modern CPUs have hardware acceleration for AES encryption.

I tested five different platforms having CPUs with and without AES hardware acceleration, different OpenSSL versions, and running on different platforms including dedicated servers, OpenVZ and AWS.

Since the processing power of each platform is different, I had to choose a criteria to normalize results, in order to be able to compare them. This was a rather confusing decision, and I hope that my conclusion is right. I chose to normalize against the “arcfour*”, “blowfish-cbc”, and “3des-cbc” speeds, because I doubt it that their implementation changed over time. They should run equally fast on each platform because they don’t benefit from the AES acceleration, nor anyone bothered to make them faster, because those ciphers are meant to be marked as obsolete for a long time.

A summary chart with the results follow:
openssh-ciphers-performance-2015-chart

You can download the raw data as an Excel file. Here is the command which was run on each server:

# uses "/root/tmp/dd.txt" as a temporary file!
for cipher in aes128-cbc aes128-ctr aes128-gcm@openssh.com aes192-cbc aes192-ctr aes256-cbc aes256-ctr aes256-gcm@openssh.com arcfour arcfour128 arcfour256 blowfish-cbc cast128-cbc chacha20-poly1305@openssh.com 3des-cbc ; do
	for i in 1 2 3 ; do
		echo
		echo "Cipher: $cipher (try $i)"
		
		dd if=/dev/zero bs=4M count=1024 2>/root/tmp/dd.txt | pv --size 4G | time -p ssh -c "$cipher" root@localhost 'cat > /dev/null'
		grep -v records /root/tmp/dd.txt
	done
done

We can draw the following conclusions:

  • Servers which run a newer CPU with AES hardware acceleration can enjoy the benefit of (1) a lot faster AES encryption using the recommended OpenSSH ciphers, and (2) some AES ciphers are now even two-times faster than the old speed champion, namely “arcfour”. I could get those great speeds only using OpenSSL 1.0.1f or newer, but this may need more testing.
  • Servers having a CPU without AES hardware acceleration still get two-times faster AES encryption with the newest OpenSSH 6.7 using OpenSSL 1.0.1k, as tested on Debian “Jessie”. Maybe they optimized something in the library.

Test results may vary (a lot) depending on your hardware platform, Linux kernel, OpenSSH and OpenSSL versions.


Leave a comment

Google App Engine Datastore benchmark

I admire the idea of Google App Engine — a platform as a service where there is “no worrying about DBAs, servers, sharding, and load balancers”. And you can “auto scale to 7 billion requests per day”. I wanted to try the App Engine for a pet project where I had to collect, process and query a huge amount of time series. The fact that I needed to do fast queries over tens of 1000’s of records however made me wonder if the App Engine Datastore would be fast enough. Note that in order to reduce the amount of entities which are fetched from the database, couples of data entries are consolidated into a single database entity. This however imposes another limitation — fetching big data entities uses more memory on the running instance.

My language of choice is Java, because its performance for such computations is great. I am using the the Objectify interface (version 4.0rc2), which is also one of the recommended APIs for the Datastore.

Unfortunately, my tests show that the App Engine is not suitable for querying of such amount of data. For example, fetching and updating 1000 entries takes 1.5 seconds, and additionally uses a lot of memory on the F1 instance. You can review the Excel sheet file below for more detailed results.

Basically each benchmark test performs the following operations and then exits:

  1. Adds a bunch of entries.
  2. Gets those entries from the database and verifies them.
  3. Updates those entries in the database.
  4. Gets the entries again from the database and verifies them.
  5. Deletes the entries.

All Datastore operations are performed in a batch and thus in an asynchronous parallel way. Furthermore, no indexes are used but the entities are referenced directly by their key, which is the most efficient way to query the Datastore. The tests were performed at two separate days because I wanted to extend some of the tests. This is indicated in the results. A single warmup request was made before the benchmarks, so that the App Engine could pre-load our application.

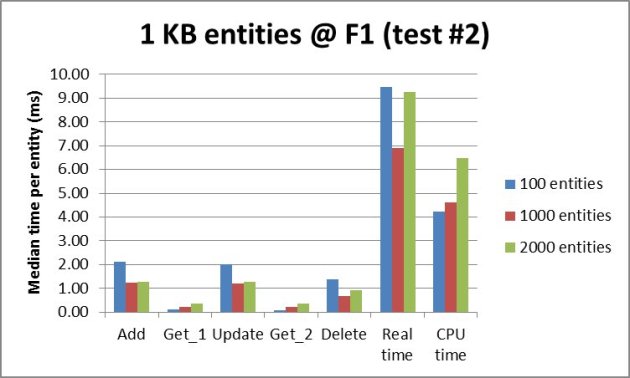
The first observation is that using the default F1 instance once we start fetching more than 100 entities or once we start to add/update/delete more than 1000 entities, we saturate the Datastore -> Objectify -> Java throughput and don’t scale any more:
App Engine Datastore median time per entity for 1 KB entities @ F1 instance

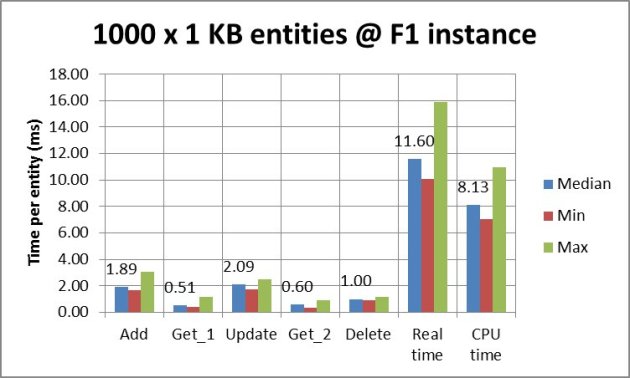
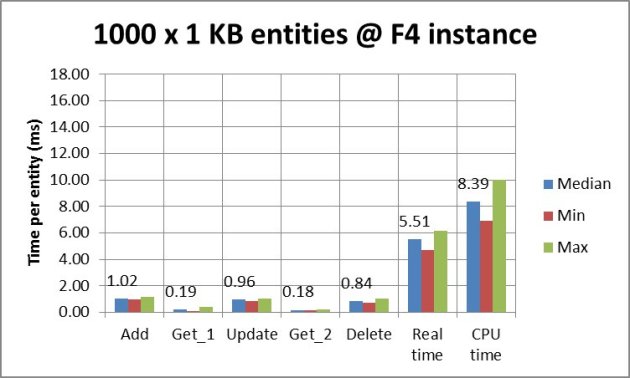
The other interesting observation is that the Datastore -> Objectify -> Java throughput depends a lot on the App Engine instance. That’s not a surprising fact because the application needs to serialize data back and forth when communicating with the Datastore. This requires CPU power. The following two charts show that more CPU power speeds up all operations where serializing is involved — that is all Datastore operations but the Delete one which only queries the Datastore by supplying the keys of the entities, no data:
App Engine Datastore times per entity for 1000 x 1 KB entities @ F1 instance

App Engine Datastore times per entity for 1000 x 1 KB entities @ F4 instance

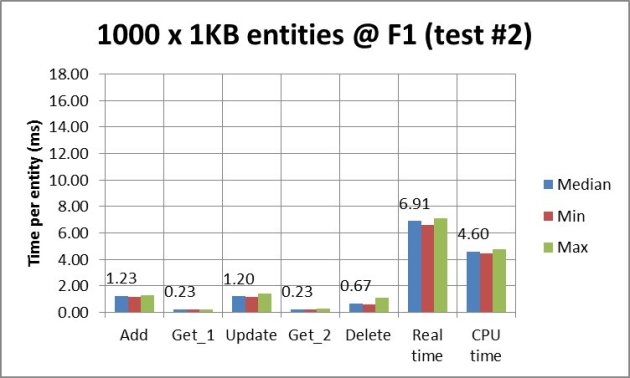
It is unexpected that the App Engine and the Datastore still have good and bad days. Their latency as well as CPU accounting could fluctuate a lot. The following chart shows the benchmark results which we got using an F1 instance. If you compare this to the chart above where a much more expensive F4 instance was used, you’ll notice that the 4-times cheaper F1 instance performed almost as fast as an F4 instance:
App Engine Datastore times per entity for 1000 x 1 KB entities @ F1 instance (test on another day)

The source code and the raw results are available for download at http://www.famzah.net/download/gae-datastore-performance/


Leave a comment

iSCSI-over-Internet performance notes

I recently played a bit with iSCSI over Internet, in order to design and implement the Locally encrypted secure remote backup over Internet.

My initial impression was that iSCSI over Internet is not usable as a backup device even though my Internet connection is relatively fast — a simple ext4 file-system format took about 24 minutes. I though that the connection latency is killing the performance. Well, I was wrong. Even after making latency two times lower by working on a server which was geographically closer, the ext4 format still took 24 minutes.

Eventually I did some tests and analysis, and finally started to use the iSCSI over Internet volume for backup purposes — and it works flawlessly so far.

Ext4 format benchmark

It turns out that it’s not the latency but my upload bandwidth which was slowing things down:

  • 1 Mbit/s upload Internet connection and Ping latency of 75 ms:
    • Time: 24 minutes.
    • Average transfer rates snapshot:
      • Total rates: 967.7 kbits/sec (212.6 packets/sec).
      • Incoming rates: 83.0 kbits/sec (92.8 packets/sec).
      • Outgoing rates: 884.6 kbits/sec (119.8 packets/sec).
    • About 200 MBytes outgoing transfer; only 12 MBytes incoming transfer (no SSH tunnel compression).
    • About 200.000 packets sent and about 130.000 received.
  • 3 Mbit/s upload Internet connection and Ping latency of 75 ms:
    • Time: 8 minutes.
    • Average transfer rates snapshot:
      • Total rates: 2580.0 kbits/sec (417.8 packets/sec).
      • Incoming rates: 128.5 kbits/sec (149.6 packets/sec).
      • Outgoing rates: 2451.5 kbits/sec (268.2 packets/sec).
    • About 160 MBytes outgoing transfer; only 9 MBytes incoming transfer (with SSH tunnel compression).
    • About 140.000 packets sent and about 80.000 received.

I know I’m missing two tests with and without SSH tunnel compression but it seems compression doesn’t make such a difference. It’s upload speed which affects the total completion time.

File copy benchmark

All tests were done without SSH compression and we make the same conclusion — it is bandwidth which affects the total completion time:

  • 1 Mbit/s upload Internet connection and Ping latency of 75 ms:
    • SSH direct file copy to server: 100 seconds (11 MBytes file).
    • File copy to an iSCSI mounted file-system: 105 seconds.
  • 3 Mbit/s upload Internet connection and Ping latency of 75 ms:
    • SSH direct file copy to server: 39 seconds (11 MBytes file).
    • File copy to an iSCSI mounted file-system: 39 seconds.

The SSH direct file copy (SCP) transfer command was “scp testf root@172.18.0.1:/tmp/”, and the file copy command was “cp testf /mnt/ ; sync”.

Server and client load during transfer, other benchmarks

During the transfer both the client and server machines were almost idle in regards to CPU. The iSCSI block storage device on the server was not saturated even at 1%.

Note that the iSCSI target was exported via an SSH tunnel, as described here. Ping tests shown no difference between a direct server ping and a ping via the SSH tunnel.

The file copy tests were done on a regular iSCSI mounted volume, and on an iSCSI volume which was encrypted using TrueCrypt. The same speeds were achieved.

Encountered problems

During the backup runs, I got several of the following kernel messages in “dmesg”. This seems like a normal warning for the iSCSI use-case scenario:

[13200.272157] INFO: task jbd2/dm-0-8:1931 blocked for more than 120 seconds.
[13200.272164] “echo 0 > /proc/sys/kernel/hung_task_timeout_secs” disables this message.
[13200.272168] jbd2/dm-0-8 D f2abdc80 0 1931 2 0x00000000


Leave a comment

Speed up RRDtool database manipulations via RRDs (Perl)

Use case
You are doing a lot of data operations on your RRD files (create, update, fetch, last), and every update is done by a separate Perl process which lives a very short time – the process is launched, it updates or reads the data, does something else, and then exits.

The problem
If you are using RRDtool and Perl as described, you surely have noticed that running many of these processes wastes a lot of CPU resources. The question is – can we do some performance optimizations, and lessen the performance hit of loading the RRDs library into Perl? We know that launching often Perl itself is quite expensive, but after all, if we chose to work with Perl, this is a price we should be ready to pay.

The RRDtool shared library is a monolithic piece of code which provides ALL functions of the RRDtool suite – data manipulation, graphics and import/export tools. The last two components bring huge dependencies in regards to other shared libraries. The library from RRDtool version 1.4.4 depends on 34 other libraries on my Linux box! This must add up to the loading time of the RRDtool library into Perl.

Resolution and benchmarks
In order to prove my theory (actually, it was more a theory of zImage, and I just followed, enhanced and tried it), I commented out the implementation of the “graphics” and “import/export tools” modules from the source code of RRDtool. Then I re-compiled the library and did some performance benchmarks. I also re-implemented the RRDs.pm module by replacing the DynaLoader module with the XSLoader one. This made no difference in performance whatsoever. The re-compiled RRD library depends on only 4 other libraries – linux-gate.so.1, libm.so.6, libc.so.6, and /lib/ld-linux.so.2. I think this is the most we can cut down. 🙂

So here are the benchmark results. They show the accumulated time for 1000 invocations of the Perl interpreter with three different configurations:

  • Only Perl (baseline): 5.454s.
  • With RRDs, no graphics or import/export functions: 9.744s (+4.290s) +78%.
  • With standard RRDs: 11.647s (+6.192s) +113%.

As you can see, you can make Perl + RRDs start 35% faster. The speed up for RRDs itself is 44%.


Here are the commands I used for the benchmarks:

  • Only Perl (baseline): time ( i=1000 ; while [ “$i” -gt 0 ]; do perl -Mwarnings -Mstrict -e ” ; i=$(($i-1)); done )
  • Perl + RRDs: time ( i=1000 ; while [ “$i” -gt 0 ]; do perl -Mwarnings -Mstrict -MRRDs -e ” ; i=$(($i-1)); done )


23 Comments

OpenSSH ciphers performance benchmark

💡 Please review the newer tests.


Ever wondered how to save some CPU cycles on a very busy or slow x86 system when it comes to SSH/SCP transfers?

Here is how we performed the benchmarks, in order to answer the above question:

  • 41 MB test file with random data, which cannot be compressed – GZip makes it only 1% smaller.
  • A slow enough system – Bifferboard. Bifferboard CPU power is similar to a Pentium @ 100Mhz.
  • The other system is using a dual-core Core2 Duo @ 2.26GHz, so we consider it fast enough, in order not to influence the results.
  • SCP file transfer over SSH using OpenSSH as server and client.

As stated at the Ubuntu man page of ssh_config, the OpenSSH client is using the following Ciphers (most preferred go first):

aes128-ctr,aes192-ctr,aes256-ctr,arcfour256,arcfour128,
aes128-cbc,3des-cbc,blowfish-cbc,cast128-cbc,aes192-cbc,
aes256-cbc,arcfour

In order to examine their performance, we will transfer the test file twice using each of the ciphers and note the transfer speed and delta. Here are the shell commands that we used:

for cipher in aes128-ctr aes192-ctr aes256-ctr arcfour256 arcfour128 aes128-cbc 3des-cbc blowfish-cbc cast128-cbc aes192-cbc aes256-cbc arcfour ; do
        echo "$cipher"
        for try in 1 2 ; do
                scp -c "$cipher" test-file root@192.168.100.102:
        done
done

You can review the raw results in the “ssh-cipher-speed-results.txt” file. The delta difference between the one and same benchmark test is within 16%-20%. Not perfect, but still enough for our tests.

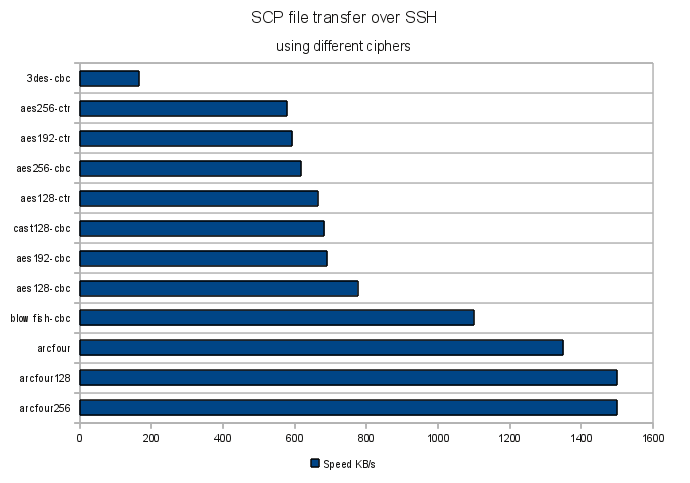
Here is a chart which visualizes the results:

The clear winner is Arcfour, while the slowest are 3DES and AES. Still the question if all OpenSSH ciphers are strong enough to protect your data remains.

It’s worth mentioning that the results may be architecture dependent, so test for your platform accordingly.
Also take a look at the below comment for the results of the “i7s and 2012 xeons” tests.


Resources:


1 Comment

Bifferboard performance benchmarks

The benchmarks were done while Bifferboard was running Linux kernel 2.6.30.5 and Debian Lenny.

Boot time
Total boot time: 1 minute 11 seconds (standard Debian Lenny base installation)

The boot process goes like this:

  • Initial boot. Mounted root device (5 seconds wasted on waiting for the USB mass storage to be initialized). Executing INIT. [+21 seconds elapsed]
  • Waiting for udev to be initialized (most of the time spent here), configuring some misc settings, no dhcp network, entering Runlevel 2. [+41 seconds elapsed]
  • Started “rsyslogd”, “sshd”, “crond”. Got prompt on the serial console. [+9 seconds elapsed]

Therefore, if a very limited and custom Linux installation is used, the total boot time could be reduced almost twice.

CPU speed
Calculated BogoMips: 56.32
According to a quite complete BogoMips list table, this is an equivalent of Pentium@133MHz or 486DX4@100MHz.

According to another CPU benchmarks comparison table for Linux, Bifferboard falls into the category of Pentium@100Mhz.

Memory speed
A “dd” write to “/dev/shm” performs with a speed of 6.3 MB/s.
The MBW memory bandwidth benchmark shows the following results:

bifferboard:/tmp# wget
http://de.archive.ubuntu.com/ubuntu/pool/universe/m/mbw/mbw_1.1.1-1_i386.deb
bifferboard:/tmp# dpkg -i mbw_1.1.1-1_i386.deb
bifferboard:/tmp# mbw 4 -n 20|egrep ^AVG
AVG Method: MEMCPY Elapsed: 0.15602 MiB: 4.00000 Copy:
25.637 MiB/s
AVG Method: DUMB Elapsed: 0.06611 MiB: 4.00000 Copy:
60.502 MiB/s
AVG Method: MCBLOCK Elapsed: 0.06619 MiB: 4.00000 Copy:
60.431 MiB/s

For comparison, my Pentium Dual-Core @ 2.50GHz with DDR2 @ 800 MHz (1.2 ns) shows a “dd” copy speed to “/dev/shm” of 271 MB/s, while the MBW test shows a maximum average speed of 7670.954 MiB/s. Bifferboard is an embedded device after all… 🙂

Available memory for applications
My base Debian installation with “udevd”, “dhclient3”, “rsyslogd”, “sshd”, “getty” and one tty session running shows 24908 kbytes free memory. You surely cannot put CNN.com on this little machine, but compared to the PIC16F877A which has 368 bytes (yes, bytes) total RAM memory, Bifferboard is a monster.

Disk system
All tests are done on an Ext3 file-system and a very fast USB Flash 8GB A-Data Xupreme 200X.
A “dd” copy to a file completes with a write speed of 6.1 MB/s.
The Bonnie++ benchmark test shows the following results:

Version 1.03d       ------Sequential Output------ --Sequential Input- --Random-
                    -Per Chr- --Block-- -Rewrite- -Per Chr- --Block-- --Seeks--
Machine        Size K/sec %CP K/sec %CP K/sec %CP K/sec %CP K/sec %CP /sec %CP
bifferboard.lo 300M   822  96  5524  61  4305  42   855  99 16576  67 143.2  12
                    ------Sequential Create------ --------Random Create--------
                    -Create-- --Read--- -Delete-- -Create-- --Read--- -Delete--
              files  /sec %CP  /sec %CP  /sec %CP  /sec %CP  /sec %CP /sec %CP
                 16  1274  94 14830 100  1965  85  1235  90 22519 100 2015  87

bifferboard.localdomain,300M,822,96,5524,61,4305,42,855,99,16576,67,143.2,12,16,1274,94,14830,100,1965,85,1235,90,22519,100,2015,87

Therefore, the sequential write speed is about 5.5 MB/s, while the sequential read speed is about 16.5 MB/s.

It’s worth mentioning that while the write tests were running, there was a very high CPU System load (not CPU I/O waiting) which indicates that the write throughput of Bifferboard may be a bit better if the file-system is not a journaling one. However, the tests for “Memory speed” above show that writing to “/dev/shm” (a memory-based file-system) completes with a rate of 6.3 MB/s. Therefore, this is probably the limit with this configuration.

Network
Both Netperf and Wget show a throughput of 6.5 MB/s.
The packets-per-second tests complete at a rate of 8000 packets/second.
Modern systems can handle several hundred thousand packets-per-second without an issue. However, the measured network performance of Bifferboard is more than enough for trivial network communication with the device. During the network benchmark tests, there was very high CPU System usage, but that was expected.

Encryption and SSH transfers
The maximum encryption rate for an eCryptfs mount with AES cipher and 16 bytes key length is 536 KB/s. The standard SSH Protocol 2 transfer rate using the OpenSSH server is about the same – 587.1 KB/s. If you try to transfer a file over SSH and store it on an eCryptfs mounted volume, the transfer rate is 272.2 KB/s, which is logical, as the processing power is split between the SSH transfer and the eCryptfs encryption.
You can try to tweak your OpenSSH ciphers, in order to get much better performance. The OpenSSH ciphers performance benchmark page will give you a starting point.

Conclusion
Bifferboard performs pretty well for its price. It’s my personal choice over the 8-bit 16F877A and the other 16-bit Microchip / ARM microcontrollers, when a project does not require very fast I/O.


Leave a comment

Benchmark the packets-per-second performance of a network device

This article is about measuring network throughput and performance using a Linux box, in a very approximate way.

There are many network performance benchmarks and stress-tests which measure the maximum bandwidth transfer rate of a device – that is how many bytes-per-second or bits-per-second a device can handle. Good examples for such benchmark tests are NetPerf, Iperf, or even multiple Wget downloads which run simultaneously and save the downloaded files to /dev/null, so that we eliminate the hard disk throughput of the local machine.

There is however another very important metric for the throughput of a network device – its packets-per-second (pps) maximum rate.

Today I struggled a lot to find out a tool which measures the packets-per-second throughput of a network device and couldn’t find a suitable one. Therefore, I tried two different methods both using the ICMP echo protocol, in order to approximately measure the packets-per-second metric of a remote network device which is directly attached to my network.

Method #1: The old-school “ping“. Execute the following as root:

ping -q -s 1 -f 192.168.100.101

This floods the destination “192.168.100.101” with the smallest possible PING packets. Here is a sample output:

--- 192.168.100.101 ping statistics ---
20551 packets transmitted, 20551 received, 0% packet loss, time 6732ms

You can calculate the packets-per-second rate by dividing the count of the packets to the elapsed time:

20551 packets / 6.732 secs ~= 3052 packets-per-second

Note that this is the count of the replies at 0% packet loss. Which means that the same count requests were sent too. So the final result is:

3052 x 2 = 6104 packets-per-second

Note that if you run multiple “ping” commands simultaneously, you will get more accurate results. You need to sum the average values from every “ping” command, in order to calculate the overall packets-per-second rate. For example, when I performed the measurement against the very same host but using two or three simultaneous “ping” commands, the average packets-per-second value was settled to 8000.

Method #2: The much faster and extended “hping3“. Execute the following:

taurus:~# time hping3 192.168.100.101 -q -i u20 --icmp|tail -n10

This will bombard the host “192.168.100.101” with ICMP echo requests. After a few seconds, you can interrupt the ping by pressing CTRL+C. Here is the output:

--- 192.168.100.101 hping statistic ---
67932 packets transmitted, 10818 packets received, 85% packet loss
round-trip min/avg/max = 0.5/7.8/15.6 ms

real 0m2.635s
user 0m0.368s
sys 0m1.160s

If the packet loss is 0%, decrease “-i u20” to something smaller like “-i u15” or less. Make sure to not decrease it too much, or you may temporarily lose connectivity to the device (because of switch problems?).

The calculations for the packets-per-second value are the same as for “ping” above. You need to divide the received packets to the time:

10818 packets / 2.635 secs ~= 4105 packets-per-second

Because the calculated packets-per-second represent the rate of successful replies, we need to multiply it by two, in order to get the actual packets-per-second, as the count of the replies is the same as the count of the successfully received requests. The final result is:

4105 x 2 = 8210 packets-per-second

The calculated value by “hping3” is the same as the one by “ping”. We are either correct, or both methods failed… 🙂


Some notes which apply for both methods:

  • You should run multiple instances of the ping commands, either from the same or from different machines, in order to be able to properly saturate the connection of the machine which is being tested.
  • The machines from which you test have a hardware rate limit too. If the host being tested has a similar rate limit, you surely need to run the ping commands from more than a single machine.
  • You should run more and more simultaneous ping commands until you start to receive similar results for the calculated packets-per-second rate. This indicates a saturation of the network bandwidth, usually at the remote host which is being tested, but may also indicate a saturation somewhere in the route between your tester machines and the tested host…
  • The ethernet switches also have a hardware limit of the bandwidth and the packets-per-second. This may influence the overall results.
  • If the tested device has any firewall rules, you should temporarily remove them, because they may slow down the packets processing.
  • If the tested device is a Linux box, you should temporarily remove the ICMP rate limits by executing “sysctl net.ipv4.icmp_ratelimit=0” and “sysctl net.ipv4.icmp_ratemask=0”.
  • If the tested device is a router, a better way to test its packets-per-second maximum rate is to flood one of its interfaces and count the output rate at the other one, assuming that you are actually flooding a host which is behind the router according to its routing tables.

Thanks to zImage for his usual willingness to help people out by giving good tips and ideas.