/contrib/famzah

Enthusiasm never stops


Leave a comment

Fix LCP issues caused by Cookiebot on Mobile

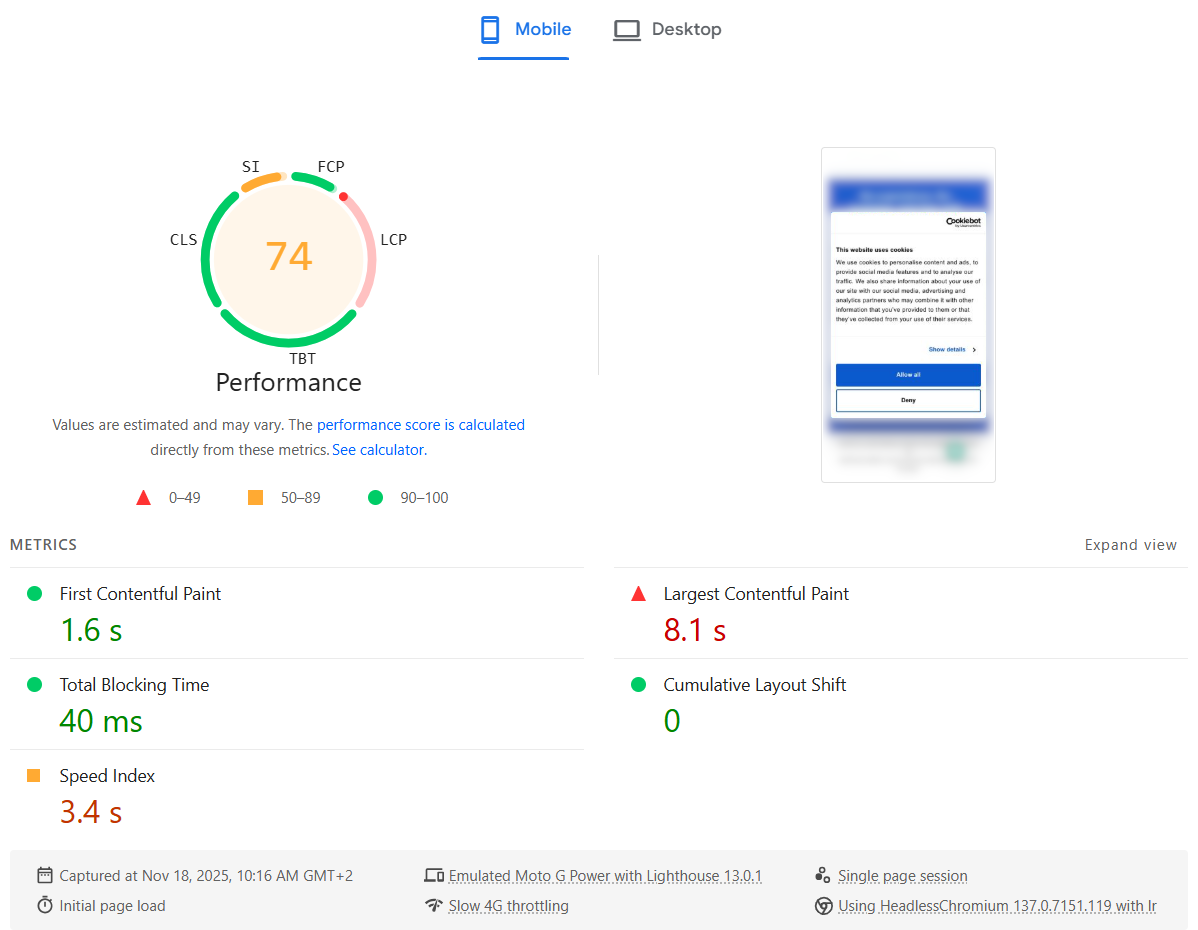
Recently we added Cookiebot to our corporate website for better GDPR and privacy compliance. Immediately after that, the PageSpeed Insights Performance score for Mobile dropped from Good (green) to Needs Improvement (orange). The Desktop score was not affected at all.

Digging into the details, the Largest Contentful Paint (LCP) metric was suddenly marked as Poor (red).

The strange part: in reality, the website still felt just as fast as before — including the Cookiebot banner. Everything appeared quickly, and users wouldn’t notice any slowdown. It felt like Lighthouse was “wrong”: it was measuring something that didn’t match the actual user experience.

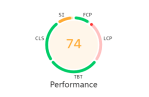
Here is what the PageSpeed Insights test showed:

Why it only happens on mobile

My theory:

  • The mobile viewport is smaller, so the Cookiebot consent dialog text block occupies a big portion of the screen.
  • That makes the Cookiebot banner the largest element in the viewport, so it becomes the LCP candidate.
  • In the Lighthouse mobile test, CPU is heavily throttled, so Cookiebot’s JavaScript (plus other third-party scripts) takes much longer to parse, execute and finish.
  • As a result, LCP is reported as very slow — even though visually the page looks complete very quickly.

In other words, the metric blames LCP on the Cookiebot dialog, but this doesn’t reflect what real users see.

The fix: make the Cookiebot dialog smaller

To fix this, we need to make sure the Cookiebot dialog is no longer the largest element in the viewport. That means shrinking its visual footprint, especially on mobile.

The main changes are:

  • Remove the Cookiebot logo banner
  • Use smaller fonts and buttons
  • Reduce the overall dialog width/height, particularly on small screens

You can apply all of this with a bit of custom CSS. Here is the CSS I used:

https://gist.github.com/famzah/c9f6d58256c6c5ddf8fdb88ac59cb963

After adding it, test the site with different devices and viewport sizes, including Desktop, Tablet and Mobile, to ensure the dialog still looks good and remains accessible.
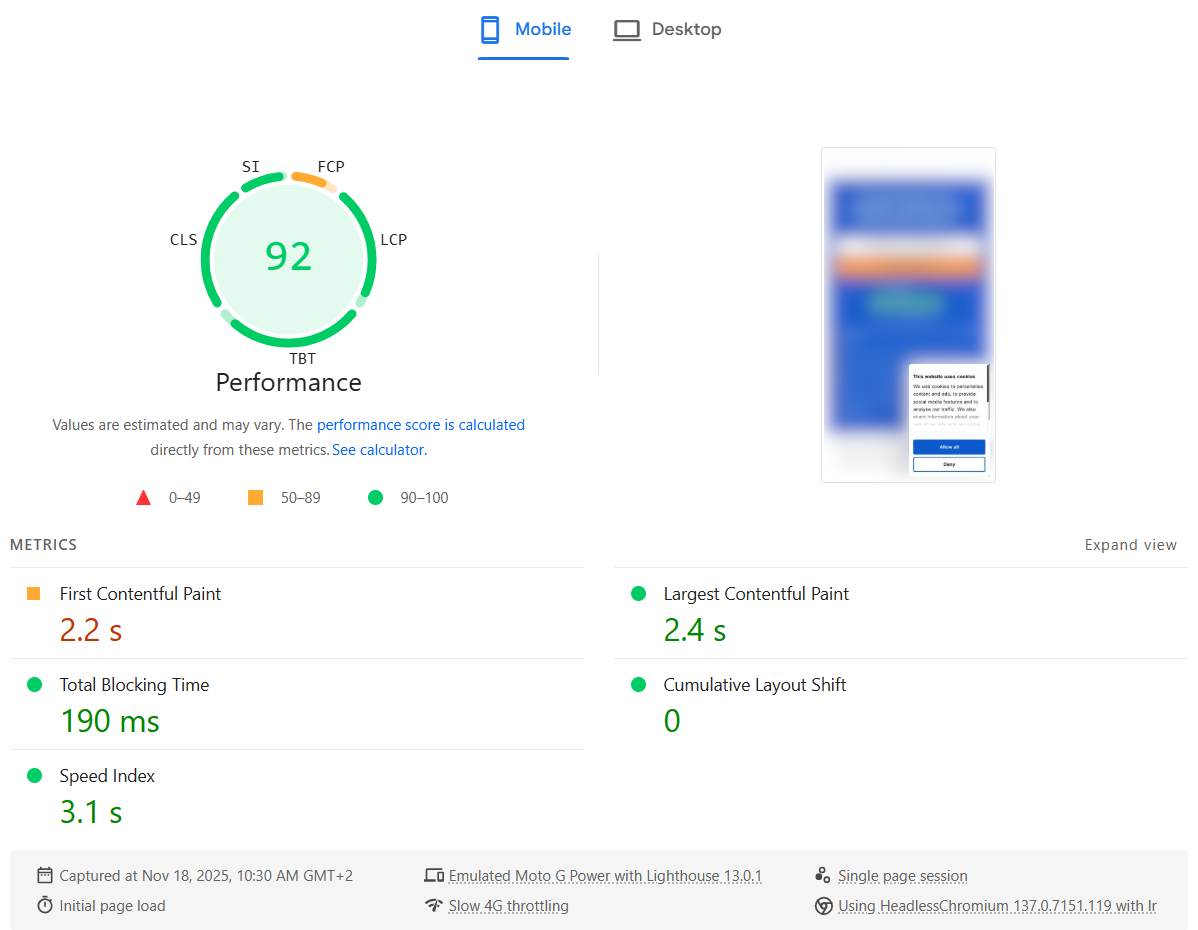
Results

After applying the CSS, the PageSpeed Insights report improved immediately: the LCP metric went back to a healthy value and the overall Mobile Performance score returned to green.

Here is what the PageSpeed Insights test showed after the fix:


So if Cookiebot is tanking your LCP score on mobile, try shrinking the consent dialog — you may be able to fix your Core Web Vital without changing anything else in your frontend.


Leave a comment

C++: Use the right size for the right job

Do you want to speed up your C++ application up to 4 times? Read on.

Recently I happened to be on a summer holiday with a friend who is a C++ guru. We discussed my language performance benchmark post, which had just received a lot of attention in regards to C++. It took him a few hours to demonstrate something really important and often underestimated by developers — that we need to allocate only as much memory as needed, and nothing more.

The C++ algorithm which we use at the benchmark blog page uses an array of “int” (which on Linux also happens to be 4 bytes == 32 bits). However, if you review the code you’ll notice that the “int” value is used as a pure boolean variable for the given array index. So my friend proposed the following optimized version, which uses 1 bit of memory for the boolean value and thus doesn’t waste the other 31-bits left if we used “int” instead:

--- primes.cpp	2013-06-17 17:16:09.000000000 +0300
+++ primes-bool.cpp	2013-06-17 18:43:28.000000000 +0300
@@ -12,9 +12,9 @@
 		res.push_back(2);
 		return res;
 	}
-	vector<int> s;
+	vector<bool> s;
 	for (int i = 3; i < n + 1; i += 2) {
-		s.push_back(i);
+		s.push_back(true);
 	}
 	int mroot = sqrt(n);
 	int half = (int)s.size();
@@ -23,9 +23,9 @@
 	while (m <= mroot) {
 		if (s[i]) {
 			int j = (int)((m*m - 3)/2);
-			s[j] = 0;
+			s[j] = false;
 			while (j < half) {
-				s[j] = 0;
+				s[j] = false;
 				j += m;
 			}
 		}
@@ -33,9 +33,9 @@
 		m = 2*i + 3;
 	}
 	res.push_back(2);
-	for (vector<int>::iterator it = s.begin() ; it < s.end(); ++it) {
-		if (*it) {
-			res.push_back(*it);
+	for (size_t it = 0; it < s.size(); ++it) {
+		if (s[it]) {
+			res.push_back(2*it + 3);
 		}
 	}

The end result is that the original C++ implementation finishes for 18.913 CPU seconds, while the memory-optimized completes in 5.354 seconds (28%). Impressive!

The bottom line is that even RAM is very fast and memory allocation is efficient, using only as few memory as really needed could vastly improve the performance of your C++ application. Which applies for programs developed in any language.


13 Comments

Using flock() in Bash without invoking a subshell

The flock(1) utility on Linux manages flock(2) advisory locks from within shell scripts or the command line. This lets you synchronize your Bash scripts with all your other applications written in Perl, Python, C, etc.

I’ll focus on the third usage form where flock() is used inside a Bash script. Here is what the man page suggests:

#!/bin/bash

(
flock -s 200

# ... commands executed under lock ...

) 200>/var/lock/mylockfile

Unfortunately, this invokes a subshell which has the following drawbacks:

  • You cannot pass values to variables from the subshell in the main shell script.
  • There is a performance penalty.
  • The syntax coloring in “vim” does not work properly. 🙂

This motivated my colleague zImage to come up with a usage form which does not invoke a subshell in Bash:

#!/bin/bash

exec {lock_fd}>/var/lock/mylockfile || exit 1
flock -n "$lock_fd" || { echo "ERROR: flock() failed." >&2; exit 1; }

# ... commands executed under lock ...

flock -u "$lock_fd"

Note that you can skip the “flock -u “$lock_fd” unlock command if it is at the very end of your script. In such a case, your lock file will be unlocked once your process terminates.


Leave a comment

Nagios: Improve CPU performance with popen_noshell()

Today I’ll share my real-world experience with popen_noshell() on the Nagios monitoring server which we run at work. We are actively monitoring 1166 hosts and 14250 services. The machine has 6 GB RAM and a single Intel Core i7-950 CPU with enabled multi-threading (8 total threads) and slight overclock. Besides running Nagios, this machine also handles the incoming data from our custom monitoring systems, processes RRD database storage, and generates web interface status + charts output. So it’s a pretty busy machine which does a lot of network activity and where the Nagios daemon is just a part of the CPU load. For example, since boot the main “nagios3” process has used only 20% of the CPU. The other part has been used by the fork()’ed Perl scripts (we use a lot of them for the active checks), the Nagios standard network checks, and the Apache/PHP web server handling the incoming data.

Recently the machine started to exhaust its CPU resources. First we overclocked it a bit which gave us 10% more CPU idle time. Then we decided to try to compile Nagios with the popen-noshell library. This gave us another 10% CPU idle and now the machine is working great again.

I’ll focus on the popen-noshell integration and results, since CPU overclocking is a well-known topic. Here is the chart which shows the CPU usage before and after we re-compiled Nagios with the popen-noshell library:

nagios-popen-noshell-benchmark-results

As we can see, the system-CPU usage dropped from 38% to 31%, which is an 18% improvement. The user-CPU usage dropped from 44% to 41%, which is a 7% improvement. Overall, we gained a 12% speed-up for our workload by just re-compiling Nagios with the popen-noshell library. I’m stressing out that the speed-up depends a lot on your workload. If this machine was busy only with Nagios and the active checks were more CPU efficient (i.e. not written in Perl but in C), then the speed-up could have been much higher, since popen_noshell() is about 10 times faster than the standard popen().

A list with the other machine metrics which were also affected by the workload change:

  • Used memory: 39% => 24% (38% less)
  • Load average: 39 => 46 (18% higher)
  • Forks rates: 8*61 => 8*61 (created processes/second – no change)

Here are the steps that you need to perform, in order to re-compile the Nagios Debian package by integrating it with the popen-noshell library:

apt-get install devscripts

apt-get build-dep nagios3-core
# No need to run as "root" from here on
apt-get source nagios3-core

svn checkout http://popen-noshell.googlecode.com/svn/trunk/ popen-noshell

cd nagios3-3.2.1/

# BEGIN: patch Nagios to use popen_noshell_compat()

cp ../popen-noshell/popen_noshell.* base/
vi base/Makefile.in
	OBJS=$(BROKER_O) popen_noshell.o 

vi base/utils.c
	#include "popen_noshell.h"
	
        /* run the command */
        struct popen_noshell_pass_to_pclose pclose_arg;
        fp=(FILE *)popen_noshell_compat(cmd,"r",&pclose_arg);

            /* close the command and get termination status */
            status=pclose_noshell(&pclose_arg);

vi base/checks.c
	2x the same as above

# END: patch Nagios to use popen_noshell_compat()

EDITOR=vim dch -i
	# 3.2.1-2+squeeze1 -> 3.2.1-2+squeeze1-noshell1
	# you must have a trailing number in the added version name
	# after exit, this renames the original directory name

cd ..
mv nagios3_3.2.1.orig.tar.gz nagios3_3.2.1-2+squeeze1.orig.tar.gz

# the source directory was renamed by "dch"
cd nagios3-3.2.1-2+squeeze1/
DEB_BUILD_OPTIONS=nocheck debuild -us -uc

cd ..
sudo dpkg -i nagios3-core_3.2.1-2+squeeze1-noshell1_i386.deb \
	nagios3-common_3.2.1-2+squeeze1-noshell1_all.deb \
	nagios3-cgi_3.2.1-2+squeeze1-noshell1_i386.deb \
	nagios3-doc_3.2.1-2+squeeze1-noshell1_all.deb \
	nagios3_3.2.1-2+squeeze1-noshell1_i386.deb


4 Comments

Bash: Split a string into columns by white-space without invoking a subshell

The classical approach is:

RESULT="$(echo "$LINE"| awk '{print $1}')" # executes in a subshell 

Processing thousands of lines this way however fork()’s thousands of processes, which affects performance and makes your script CPU hungry.

Here is a more efficient way to do it:

LINE="col0 col1  col2     col3  col4      "
COLS=()

for val in $LINE ; do
        COLS+=("$val")
done

echo "${COLS[0]}"; # prints "col0"
echo "${COLS[1]}"; # prints "col1"
echo "${COLS[2]}"; # prints "col2"
echo "${COLS[3]}"; # prints "col3"
echo "${COLS[4]}"; # prints "col4"

If you want to split not by white-space but by any other character, you can temporarily change the IFS variable which determines how Bash recognizes fields and word boundaries.

P.S. For the record, here is the old solution:

#
# OLD CODE
# Update: Aug/2016: I've encountered a bug in Bash where this splitting doesn't work as expected! Please see the comments below.
#

# Here is the effective solution which I found with my colleagues at work:

COLS=( $LINE ); # parses columns without executing a subshell
RESULT="${COLS[0]}"; # returns first column (0-based indexes)

# Here is an example:

LINE="col0 col1  col2     col3  col4      " # white-space including tab chars
COLS=( $LINE ); # parses columns without executing a subshell

echo "${COLS[0]}"; # prints "col0"
echo "${COLS[1]}"; # prints "col1"
echo "${COLS[2]}"; # prints "col2"
echo "${COLS[3]}"; # prints "col3"
echo "${COLS[4]}"; # prints "col4"


Leave a comment

iSCSI-over-Internet performance notes

I recently played a bit with iSCSI over Internet, in order to design and implement the Locally encrypted secure remote backup over Internet.

My initial impression was that iSCSI over Internet is not usable as a backup device even though my Internet connection is relatively fast — a simple ext4 file-system format took about 24 minutes. I though that the connection latency is killing the performance. Well, I was wrong. Even after making latency two times lower by working on a server which was geographically closer, the ext4 format still took 24 minutes.

Eventually I did some tests and analysis, and finally started to use the iSCSI over Internet volume for backup purposes — and it works flawlessly so far.

Ext4 format benchmark

It turns out that it’s not the latency but my upload bandwidth which was slowing things down:

  • 1 Mbit/s upload Internet connection and Ping latency of 75 ms:
    • Time: 24 minutes.
    • Average transfer rates snapshot:
      • Total rates: 967.7 kbits/sec (212.6 packets/sec).
      • Incoming rates: 83.0 kbits/sec (92.8 packets/sec).
      • Outgoing rates: 884.6 kbits/sec (119.8 packets/sec).
    • About 200 MBytes outgoing transfer; only 12 MBytes incoming transfer (no SSH tunnel compression).
    • About 200.000 packets sent and about 130.000 received.
  • 3 Mbit/s upload Internet connection and Ping latency of 75 ms:
    • Time: 8 minutes.
    • Average transfer rates snapshot:
      • Total rates: 2580.0 kbits/sec (417.8 packets/sec).
      • Incoming rates: 128.5 kbits/sec (149.6 packets/sec).
      • Outgoing rates: 2451.5 kbits/sec (268.2 packets/sec).
    • About 160 MBytes outgoing transfer; only 9 MBytes incoming transfer (with SSH tunnel compression).
    • About 140.000 packets sent and about 80.000 received.

I know I’m missing two tests with and without SSH tunnel compression but it seems compression doesn’t make such a difference. It’s upload speed which affects the total completion time.

File copy benchmark

All tests were done without SSH compression and we make the same conclusion — it is bandwidth which affects the total completion time:

  • 1 Mbit/s upload Internet connection and Ping latency of 75 ms:
    • SSH direct file copy to server: 100 seconds (11 MBytes file).
    • File copy to an iSCSI mounted file-system: 105 seconds.
  • 3 Mbit/s upload Internet connection and Ping latency of 75 ms:
    • SSH direct file copy to server: 39 seconds (11 MBytes file).
    • File copy to an iSCSI mounted file-system: 39 seconds.

The SSH direct file copy (SCP) transfer command was “scp testf root@172.18.0.1:/tmp/”, and the file copy command was “cp testf /mnt/ ; sync”.

Server and client load during transfer, other benchmarks

During the transfer both the client and server machines were almost idle in regards to CPU. The iSCSI block storage device on the server was not saturated even at 1%.

Note that the iSCSI target was exported via an SSH tunnel, as described here. Ping tests shown no difference between a direct server ping and a ping via the SSH tunnel.

The file copy tests were done on a regular iSCSI mounted volume, and on an iSCSI volume which was encrypted using TrueCrypt. The same speeds were achieved.

Encountered problems

During the backup runs, I got several of the following kernel messages in “dmesg”. This seems like a normal warning for the iSCSI use-case scenario:

[13200.272157] INFO: task jbd2/dm-0-8:1931 blocked for more than 120 seconds.
[13200.272164] “echo 0 > /proc/sys/kernel/hung_task_timeout_secs” disables this message.
[13200.272168] jbd2/dm-0-8 D f2abdc80 0 1931 2 0x00000000


Leave a comment

Google App Engine Performance Profiling

When developing under Google App Engine, developers need to pay attention to how fast their code works, and also how much resources their code uses. The first parameter is vital for user-experience, the second – for the hosting expenses, as resources usage costs money.

It turns out that there are quite a few suitable profilers for Google App Engine. At least these are the ones I could find:

  • Appstats – no doubt, the most advanced one, giving you information about the timing and costs of your RPC calls to the datastore, Memcache, etc.
    Works for both Python, and Java. Included in the official SDK as of version 1.3.1.
  • appengine-profiler – besides being an RPC profiler like Appstats, appengine-profiler gives you the option to profile the CPU usage of your code, thus you can easily identify hot-spots where your code wastes a lot of CPU resources and wall-clock time. You can define “tracepoints” which surround part of your code blocks, and you’ll easily know the resources usage of these blocks for each page load.
    Works for Python.
  • AppWrench – the Java profiler. I don’t code on Java, and I haven’t tested this profiler, but I’m including it here for all you Java gurus.

Resources:


Leave a comment

Speed up RRDtool database manipulations via RRDs (Perl)

Use case
You are doing a lot of data operations on your RRD files (create, update, fetch, last), and every update is done by a separate Perl process which lives a very short time – the process is launched, it updates or reads the data, does something else, and then exits.

The problem
If you are using RRDtool and Perl as described, you surely have noticed that running many of these processes wastes a lot of CPU resources. The question is – can we do some performance optimizations, and lessen the performance hit of loading the RRDs library into Perl? We know that launching often Perl itself is quite expensive, but after all, if we chose to work with Perl, this is a price we should be ready to pay.

The RRDtool shared library is a monolithic piece of code which provides ALL functions of the RRDtool suite – data manipulation, graphics and import/export tools. The last two components bring huge dependencies in regards to other shared libraries. The library from RRDtool version 1.4.4 depends on 34 other libraries on my Linux box! This must add up to the loading time of the RRDtool library into Perl.

Resolution and benchmarks
In order to prove my theory (actually, it was more a theory of zImage, and I just followed, enhanced and tried it), I commented out the implementation of the “graphics” and “import/export tools” modules from the source code of RRDtool. Then I re-compiled the library and did some performance benchmarks. I also re-implemented the RRDs.pm module by replacing the DynaLoader module with the XSLoader one. This made no difference in performance whatsoever. The re-compiled RRD library depends on only 4 other libraries – linux-gate.so.1, libm.so.6, libc.so.6, and /lib/ld-linux.so.2. I think this is the most we can cut down. 🙂

So here are the benchmark results. They show the accumulated time for 1000 invocations of the Perl interpreter with three different configurations:

  • Only Perl (baseline): 5.454s.
  • With RRDs, no graphics or import/export functions: 9.744s (+4.290s) +78%.
  • With standard RRDs: 11.647s (+6.192s) +113%.

As you can see, you can make Perl + RRDs start 35% faster. The speed up for RRDs itself is 44%.


Here are the commands I used for the benchmarks:

  • Only Perl (baseline): time ( i=1000 ; while [ “$i” -gt 0 ]; do perl -Mwarnings -Mstrict -e ” ; i=$(($i-1)); done )
  • Perl + RRDs: time ( i=1000 ; while [ “$i” -gt 0 ]; do perl -Mwarnings -Mstrict -MRRDs -e ” ; i=$(($i-1)); done )


1 Comment

Firefox 3.6 menu and right-click are slow on Kubuntu Lucid

If you have installed a fresh copy of Kubuntu Lucid as I did, on two different computers, and your Firefox main menus or right-click context menus are being shown slowly (i.e. take several seconds to appear), then I can tell you what it was not for me. And later I’ll tell you how I fixed it. 🙂

It was not:

  • Firefox settings in “~/.mozilla”, add-ons or extensions. Disable/enable makes no difference.
  • nVidia drivers, or any other video drivers like ATI, etc, as you’ll see below.
  • GTK theme.
  • Custom fonts.
  • The Xorg server.
  • Anything I could easily spot via strace, because Firefox is very complicated for me.
  • Kubuntu theme.
  • Firefox safe-mode doesn’t help either.

I’ve tried it all. The problem was in the global network settings, and more exactly in “/etc/hosts“.
Logical, no? 🙂

The fix: You need to make sure that “localhost” is defined properly for “127.0.0.1” and not defined for the IPv6 configuration like it was by default on my two newly set up Kubuntu boxes.

That’s a bad “/etc/hosts” file:

127.0.0.1       localhost

# The following lines are desirable for IPv6 capable hosts
::1     localhost ip6-localhost ip6-loopback
... (and so on)

That’s the fixed “/etc/hosts” file:

127.0.0.1       localhost

# The following lines are desirable for IPv6 capable hosts
::1     ip6-localhost ip6-loopback
... (and so on)

Pay attention that on line #1 there is “localhost” defined for “127.0.0.1”, and on line #4 there is no “localhost” for the IPv6 address “::1”.

Enjoy your faster Firefox.

Update: It seems that “localhost” must be defined for IPv6, according to the Ubuntu developers. This is discussed in Ubuntu Bug #301430: ipv6 /etc/hosts missing localhost hostname. I’ll leave it up to you to decide if you want to risk breaking your IPv6 or other functionality.

P.S. Also enjoy Steve Ballmer and his “Developers, developers, developers…”!


Resources:


2 Comments

Why /sys/block/dm-0/queue/scheduler exists on my Linux system?

The device-mapper (DM) traditionally didn’t have its own I/O scheduler. Then why suddenly my DM devices have such a scheduler and what does it control?


A new type of device-mapper was introduced recently in the Linux kernel 2.6.31 – the request-based device-mapper. According to the Linux Kernel Newbies changelog for 2.6.31, there is a commit which does “Prepare for request based option”.

The issue is actually not in the new request-based DM option, which is to be used only for multipath block devices. The problem is that when you create a regular LVM device on kernels 2.6.31+, the DM device itself has I/O scheduler parameters. So does the underlying block device on top of which you created the LVM. Thus we are having two I/O schedulers in the path from the LVM device to the physical storage.

According to the author of the kernel patches for the request-based DM device, Kiyoshi Ueda, for a bio-based DM device, only the underlying device’s scheduler should affect performance. This is what my tests shown too, therefore there is no discrepancy.

Let me summarize this:

  • If you are *not* using multipath block devices in your DM/LVM setup, then only the underlying device’s scheduler (i.e. “/sys/block/sda/queue/scheduler”) takes effect. This applies for the trivial LVM setup which many of us used for years.
  • If you are using a multipath DM/LVM setup, then only the DM device’s scheduler (i.e. “/sys/block/dm-0/queue/scheduler”) takes effect.

References: